DefiLlama, the go-to platform for transparent DeFi analytics, just dropped a game-changer for crypto enthusiasts. In a recent announcement on X (formerly Twitter), they revealed that yield charts are now live on their Pro dashboards. This means you can now easily chart the Annual Percentage Yield (APY) and Total Value Locked (TVL) over time for more than 19,000 DeFi pools. If you're into yield farming or just keeping tabs on where the liquidity is flowing, this update is huge.
What Are Yield Charts and Why Do They Matter?
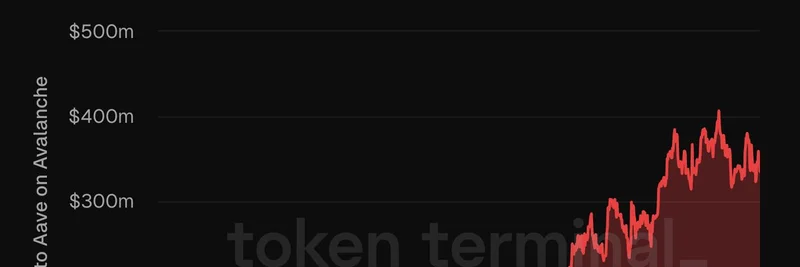
For the uninitiated, APY is basically the rate of return you can expect on your staked or lent assets in a DeFi pool, accounting for compounding interest. TVL, on the other hand, measures the total amount of assets locked in a protocol—think of it as a gauge of popularity and trust in that pool. Before this update, tracking these metrics over time often meant juggling multiple tools or spreadsheets. Now, with DefiLlama Pro, it's all in one place.
The feature lets you filter pools by chains (like Ethereum, Solana, or Binance Smart Chain), projects, categories (such as DEXes or lending platforms), and even TVL ranges. Want to see how a specific meme token pool's yield has fluctuated? Just search and add it to your dashboard. This is particularly useful for meme token traders, as many viral memes launch with high-yield farming pools to attract liquidity, but those APYs can drop fast as more people jump in.
How to Use the New Yield Charts
Getting started is straightforward. Head over to DefiLlama Pro and create a custom dashboard. From there:
- Select "Charts" and choose "% Yields" as your metric.
- Filter by your preferred chains, projects, or categories.
- Search for specific yield pools—there are over 19,000 to pick from.
- Preview and add the chart to track APY and TVL trends.
The video demo in the announcement shows it in action: a sleek dark-mode interface where you can quickly build multi-charts. It's designed for both casual users and hardcore analysts, making complex data accessible without overwhelming you.
Community Reactions and Implications for Meme Tokens
The crypto community on X is buzzing about this. @SwapHunt pointed out that while DeFi is concentrated in the top pools, this tool helps spot under-the-radar opportunities or short-term volatility—perfect for meme token hunters chasing high APYs. Other users are excited about the ease of tracking, with comments like "Alpha unlocked" and "This will make tracking yields so much easier."
For meme token enthusiasts, this is a boon. Meme coins often integrate with DeFi protocols for liquidity pools, and volatile yields are common. Tools like this can help you decide when to farm a new meme launch or exit before the APY crashes. Pair it with resources like LlamaFolio for portfolio tracking, and you're set to navigate the wild world of meme DeFi.
If you're building your knowledge base on meme tokens and blockchain tech, features like DefiLlama's yield charts are essential. They provide the data backbone to make informed decisions, whether you're yield farming a hot new meme or analyzing market trends. Stay tuned to Meme Insider for more updates on how tools like this are shaping the crypto landscape.