If you’re into meme coins and trading, you’ve probably heard the buzz around $PUMP lately. A recent post on X by Nico caught our eye, and it’s worth breaking down for anyone looking to get ahead in the crypto game. Posted on July 23, 2025, at 13:44 UTC, Nico shared a detailed chart from Hyperliquid showing the lowest funding rate to date across perpetual markets for $PUMP. Let’s unpack what this means and how you can use it to your advantage.
What’s the Funding Rate All About?
For those new to trading, the funding rate is like a heartbeat for perpetual futures contracts. It’s a periodic payment that keeps the futures price in line with the spot price of a cryptocurrency. When the rate is positive, traders holding long positions (betting the price will go up) pay those with short positions (betting it will drop). If it’s negative, the reverse happens. This mechanism helps avoid big price gaps between the futures and spot markets, making it a key signal for market sentiment.
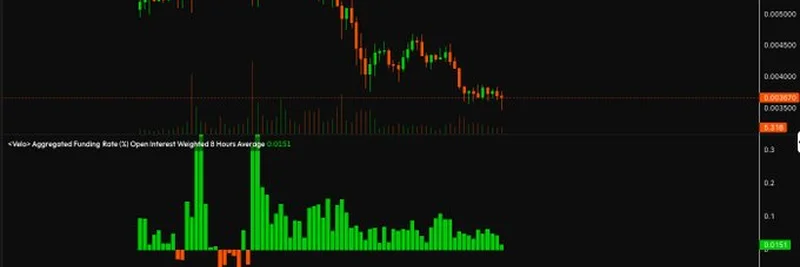
In Nico’s chart, the funding rate for $PUMP is still positive but trending downward. The aggregated funding rate is at 0.015%, which is the lowest seen so far. This drop suggests that the enthusiasm for long positions is cooling off, and the market might be gearing up for a shift.
Reading the Chart: What’s Happening with $PUMP?
The chart Nico shared is a goldmine of info. The top section shows the price action over a 4-hour period, with a clear peak followed by a sharp decline. This volatility is typical for meme coins like $PUMP, which can swing wildly based on hype and trader behavior. The middle section highlights the funding rate, with green bars showing positive rates and a recent dip indicating less pressure from long traders. The bottom part compares funding rates across exchanges, reinforcing the trend of declining rates.
Nico’s take? He’s planning to flip to a long position when the funding rate turns negative. This strategy hinges on the idea that a negative rate could signal an oversupply of short positions, potentially leading to a price rebound. It’s a contrarian move that experienced traders often use to catch reversals.
Why This Matters for Meme Coin Traders
$PUMP, like many meme coins, thrives on community hype and speculative trading. The funding rate gives us a peek into what traders are thinking. A decreasing positive rate might mean the bullish momentum is fading, while a negative rate could hint at a buying opportunity. However, it’s not a crystal ball—pairing this with other indicators like trading volume and price trends is a smart move to avoid surprises.
For those trading on platforms like Hyperliquid, keeping an eye on these rates (updated every 8 hours in most cases) can help you stay one step ahead. Nico’s insight aligns with a broader strategy of using funding rates to time entries and exits, especially in the wild world of meme tokens.
Tips for Trading $PUMP Based on This Data
- Watch for the Flip: If the funding rate turns negative, it might be time to consider a long position, as Nico suggests. Set alerts to catch this shift.
- Combine Indicators: Don’t rely solely on funding rates. Check the price chart and volume to confirm your strategy.
- Stay Updated: Meme coins move fast. Follow updates on meme-insider.com or X threads like this one to stay in the loop.
This analysis from Nico’s post is a great example of how traders can use real-time data to navigate the meme coin market. Whether you’re a seasoned pro or just dipping your toes into $PUMP, understanding funding rates can give you an edge. What do you think—will you follow Nico’s lead and flip long when the rate dips negative? Drop your thoughts in the comments, and let’s discuss!

