Hey there, meme token enthusiasts! If you've been keeping an eye on the crypto market, you’ve probably noticed the wild ride that Solana (SOL) has been on lately. A recent post by @chonglongg on X has sparked some buzz, calling out the "mental illness price action" of SOLUSD over the past 500 days. Let’s break it down and see what’s really going on with this popular blockchain token.
The Chart That’s Got Everyone Talking
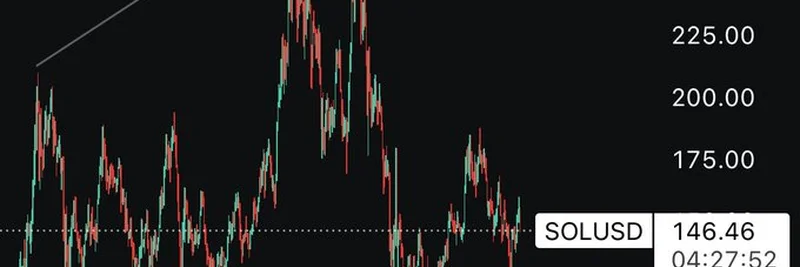
The image shared in the tweet shows a price chart for SOLUSD, highlighting a downward trend that’s been testing the patience of investors. With the price hovering around $146.46 as of 04:27:52 on the chart, it’s clear that Solana has seen better days. The chart features two trendlines forming a descending triangle—a pattern often watched by technical analysts. This suggests that the price might be consolidating before a potential breakout, either upward or downward.
What stands out is the frustration in @chonglongg’s words. After 500 days of what feels like unpredictable swings, it’s easy to see why some are calling this a "mental illness cycle." The red and green candlesticks tell a story of volatility, with sharp drops and brief recoveries, leaving traders on edge.
What’s Behind the Chaos?
Solana’s price action isn’t just random noise—it’s influenced by a mix of market sentiment, broader crypto trends, and the unique nature of meme tokens. As a high-performance blockchain, Solana often attracts attention from developers and investors alike, but its price can be swayed by hype cycles similar to those seen in meme coins like Dogecoin or Shiba Inu. The tweet’s mention of "500 days straight" points to a prolonged bearish phase, which could be part of a larger market cycle.
In crypto, these cycles typically include an up phase (bull market), a peak, a down phase (bear market), and a trough. Right now, it seems like Solana might be in that down phase, where selling pressure and pessimism dominate. But here’s the kicker: these troughs often set the stage for the next big rally. If you’re a blockchain practitioner, this could be a chance to dig into Solana’s staking trends or on-chain data to spot early signs of recovery.
What This Means for Meme Token Fans
At Meme Insider, we love diving into the quirky world of meme tokens, and Solana’s ecosystem has its share of fun projects. The price action might feel like a rollercoaster, but it’s also a reminder of the high-risk, high-reward nature of this space. The conversation in the thread, with replies like @DeadassDrew’s "Literal rape and euphoria no in between," captures the emotional highs and lows that come with trading these assets.
For those holding SOL or related meme tokens, this could be a time to hold steady or even look for buying opportunities if the price stabilizes. Technical analysis tools, like the trendlines on this chart, can help you anticipate where Solana might head next. A break above key resistance levels (maybe around $210, as some analysts suggest) could signal a bullish turn.
Looking Ahead
As of today, July 2, 2025, at 06:03 AM +07, the crypto market is still buzzing with speculation. The Solana chart shared by @chonglongg is a snapshot of a longer journey, and it’s a great reminder to stay informed. Whether you’re a seasoned trader or just dipping your toes into meme tokens, keeping an eye on price patterns and community sentiment on platforms like X can give you an edge.
What do you think about Solana’s wild ride? Drop your thoughts in the comments, and let’s keep the conversation going! For more insights into meme tokens and blockchain trends, check out our knowledge base at Meme Insider. Stay curious, and happy investing!


