In the ever-volatile world of cryptocurrency, Bitcoin's price movements often set the tone for the entire market—including the wild ride that is meme coins. Recently, crypto commentator and analyst MartyParty shared a detailed breakdown on X (formerly Twitter) about what he calls the "new cycle" 50% pullback on the four-hour chart. If you're trading meme tokens or just keeping an eye on blockchain trends, this insight could be a game-changer. Let's break it down step by step.
Understanding the 50% Pullback
A pullback in crypto trading refers to a temporary dip in price after a significant upward move. MartyParty is honing in on a 50% retracement level, which is a common technical analysis tool based on Fibonacci ratios. Essentially, it's the midpoint between a recent high and low, often acting as a support or resistance zone where prices might bounce or reverse.
According to the original post, MartyParty calculated these levels across major platforms:
- Coinbase Spot: $100,346
- Binance Spot: $99,963
- Binance Futures: $100,291
These figures suggest Bitcoin is testing the psychological $100,000 mark, a level that's been a magnet for traders. For meme coin enthusiasts, this is crucial because altcoins and memes often amplify Bitcoin's moves—dipping harder during pullbacks but potentially surging higher in recoveries.
Liquidation Levels: The Hidden Danger
Liquidation levels are price points where leveraged positions get automatically closed out to prevent further losses for exchanges. MartyParty highlights two key ones:
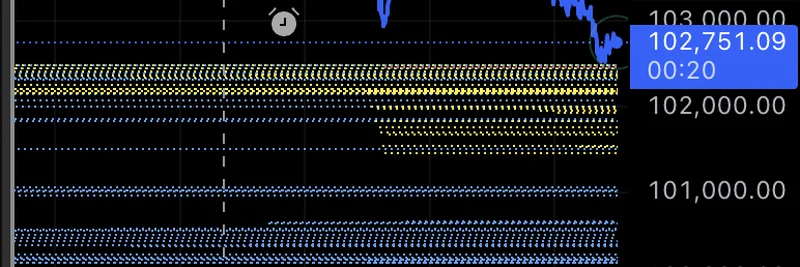
- Yesterday's lowest blue line: $100,061
- Today's lowest blue line: $99,528
In simple terms, if Bitcoin dips to these zones, it could trigger a cascade of forced sales from over-leveraged traders, amplifying the downside pressure. We've seen this play out in past cycles, where liquidations wipe out billions in value overnight. For meme tokens, which thrive on hype and momentum, such events can lead to even steeper corrections—think 70-90% drops in tokens like Dogecoin or newer entrants during broader market fear.
MartyParty's charts (included in his post) visualize these levels with blue lines, showing how they're clustering around the $100K area. This setup indicates potential short-term support, but a break below could spell trouble for riskier assets.
Community Reactions and Broader Implications
The post sparked a mix of frustration and opportunism in the replies. One user lamented, "How many times are people going to plow into the same levered long trade only to get torched," highlighting the perils of leverage in crypto. Another quipped about the "100k magnet" that never misses, while a trader excitedly placed a spot buy order hoping for a fill at lower prices.
For blockchain practitioners diving into meme tokens, this analysis underscores the importance of risk management. Meme coins, built on community-driven narratives rather than fundamentals, are particularly sensitive to Bitcoin's whims. If BTC stabilizes around these pullback levels, it could signal the start of a new upward leg—potentially boosting meme projects with strong communities or upcoming catalysts.
On the flip side, persistent downside might push capital toward safer havens, delaying the next meme coin frenzy. Tools like on-chain analytics or sentiment trackers can help gauge this; for instance, monitoring whale movements on platforms like DexScreener could provide early warnings.
Staying Ahead in the Meme Game
As a former CoinDesk editor, I've seen countless cycles where technical levels like these dictate the narrative. MartyParty's breakdown is a timely reminder to zoom out and consider the bigger picture. Whether you're hodling meme tokens or scouting new launches, keep an eye on these liquidation clusters—they could be the difference between a profitable trade and a painful lesson.
If you're building your knowledge base on meme tokens, check out our guides on top meme coin strategies or understanding blockchain volatility. Stay tuned to Meme Insider for more updates on how macro events like this shape the meme ecosystem.