In the ever-volatile world of cryptocurrency, Bitcoin often sets the tone for the entire market. Recently, a tweet from crypto commentator and analyst MartyParty (@martypartymusic) caught the attention of traders and enthusiasts alike, pointing out a suspiciously precise 50% pullback in BTC's price action.
What Happened in the Bitcoin Market?
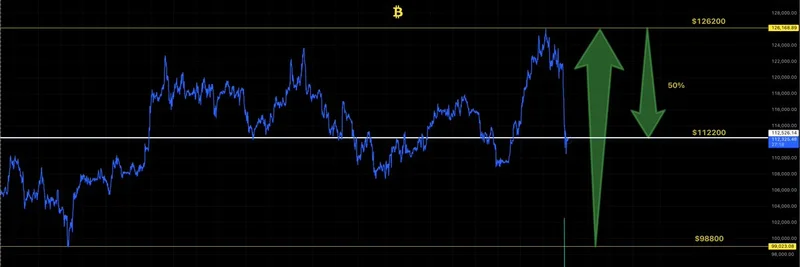
MartyParty's post highlights a pullback from the June low of around $98,800 to the October high of $126,200—a move that represents a clean 50% retracement. For those new to trading lingo, a retracement is when the price pulls back from a recent high or low, often following patterns like Fibonacci levels. Here, the 50% level is a key Fibonacci retracement point, acting as a potential support or resistance zone.
What's striking is how Bitcoin hit this exact level "to the cent," as MartyParty puts it. He emphasizes that this isn't a coincidence and questions whether the price candle (a visual representation of price movement over a period) is truly organic. In simpler terms, he's suggesting that market forces—possibly large players or institutions—might be engineering these moves rather than letting natural supply and demand play out.
This observation ties into his broader work on liquidation levels, which are price points where leveraged positions get forcibly closed, often leading to cascading sell-offs or buys. MartyParty mentions this 50% level corresponds to the "white thick line" on his liquidation chart, a tool he streams for his audience to track potential wipeouts of overleveraged traders.
Community Reactions and Broader Implications
The tweet sparked a flurry of responses. Some users, like @BuskulicDino, expressed frustration: "But how are we ever supposed to go up if this shit is constant?" Others sought clarity, with @doubledownloss asking, "So what does this mean exactly?" And @Apek_dave echoed the sentiment of precision being "wild" and unlikely coincidental.
Discussions veered into potential external factors, such as geopolitical tensions. One reply speculated on panic selling if China announces counter-measures, possibly referencing ongoing trade or tariff issues. Another drew parallels to manipulated markets like gold ETFs, hinting at similar tactics in crypto.
For meme token enthusiasts, this is particularly relevant. Bitcoin's movements often dictate the flow of capital in the crypto ecosystem. When BTC experiences sharp pullbacks or liquidations, it can trigger risk-off sentiment, leading to sell-offs in higher-risk assets like meme coins. Projects built on hype and community, such as those on Solana or Ethereum, might see amplified volatility. On the flip side, if this pullback holds as support, it could signal a bounce that pumps liquidity back into alts and memes.
Why This Matters for Meme Token Traders
At Meme Insider, we focus on the wild world of meme tokens, but understanding Bitcoin's macro picture is crucial. Liquidation events like the one MartyParty describes can create opportunities—or pitfalls—for meme traders. For instance, a engineered dip might flush out weak hands, setting the stage for a meme coin rally if BTC stabilizes.
Tools like liquidation heatmaps and Fibonacci retracements aren't just for BTC whales; savvy meme degens use them to time entries into tokens like DOGE or newer viral projects. If you're holding or eyeing meme tokens, keep an eye on these BTC levels—MartyParty's chart suggests $112,200 as a critical point, with potential downside to $105,000 if broken.
Looking Ahead: Organic or Orchestrated?
MartyParty's analysis raises timeless questions in crypto: How much of the market is truly free? With increasing institutional involvement—from ETFs to big-money trades—the line between organic price discovery and manipulation blurs. As one reply noted, breaking above $118,000 resistance could fuel a rebound to $122,000, potentially reigniting bull momentum.
Whether you're a Bitcoin maximalist or a meme token chaser, staying informed on these patterns can sharpen your edge. Follow analysts like MartyParty for real-time insights, and always DYOR (do your own research) before making moves. The crypto game is full of surprises, but patterns like this 50% pullback remind us: knowledge is your best defense against the unexpected.