In the ever-volatile world of cryptocurrency, timing the market can feel like trying to catch lightning in a bottle. But what if historical patterns could give us a clearer picture? That's exactly what crypto analyst TechDev is highlighting in a recent tweet that's sparking conversations across the community.
TechDev shared a compelling chart on X (formerly Twitter), pointing out that every major Bitcoin top has occurred roughly 14 months after a specific inflection point in the market cycle. Despite this, many traders and investors are buzzing that we're nearing the end of the current bull run. "Every Bitcoin top has been 14 months from this point, yet many think we’re almost done," TechDev tweeted, accompanied by a logarithmic chart illustrating these cycles.
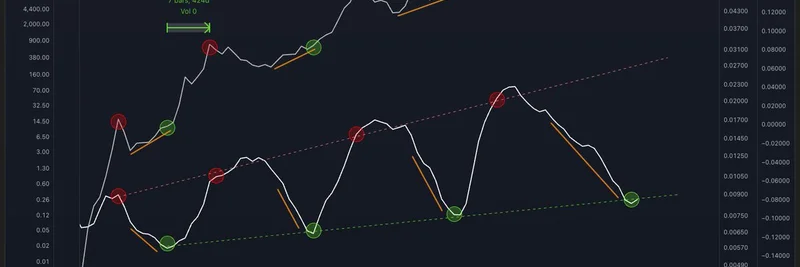
Understanding the Chart
Let's break this down simply. The chart uses a logarithmic scale to plot Bitcoin's price over time, with colored lines representing different cycle phases. Red circles mark cycle lows, green ones indicate highs, and the orange lines show trend channels. What stands out is the consistent timing: from the moment Bitcoin breaks out of its accumulation phase (that key point), it takes about 14 months to reach the peak.
But here's the kicker—one reply notes the chart is about a month old, shaving that timeline down to 13 months. Still, that's a far cry from the "top is in" calls we're hearing from some corners of the crypto space. As TechDev implies, we might have more room to run.
How This Ties into Meme Tokens
At Meme Insider, we're all about meme tokens—the fun, viral side of crypto that often rides the waves of bigger players like Bitcoin. If this analysis holds water, an extended Bitcoin bull run could mean golden opportunities for meme coins. Historically, altcoins and memes explode in the later stages of a BTC rally, as money flows from the king into riskier assets.
Think about it: during the 2021 bull market, we saw Dogecoin and Shiba Inu skyrocket as Bitcoin peaked. If we're truly 13-14 months out from the top, that gives meme token projects plenty of time to build hype, launch innovations, and capture retail interest. Projects on chains like Solana or Base could see massive inflows, especially if Bitcoin stabilizes above $100K.
Community Reactions and Counterpoints
The tweet didn't go unnoticed, drawing a mix of agreement and skepticism. One user, ₿lackthorne, emphasized that tops are "liquidity events, not calendar events," listing signs like fading ETF flows, on-chain distribution, and derivatives overheating as true indicators of a peak. TechDev agreed, noting these symptoms align with business cycle heartbeats.
Others were more bearish. "The top is coming within 4 months," quipped one reply, while another accused TechDev of "technical bullshit" from past cycles. Yet, optimists like Decode argued against following the herd, suggesting a local top might fool many, but the real cycle high is further out.
These debates highlight the uncertainty in crypto, but they also underscore the value of data-driven analysis like TechDev's.
What This Means for You
If you're a blockchain practitioner or meme token enthusiast, this could be a signal to stay positioned. Don't get shaken out by short-term dips—focus on fundamentals. Keep an eye on Bitcoin dominance; a drop could signal the altseason we've all been waiting for.
For more insights on how market cycles impact meme tokens, check out our knowledge base on crypto bull runs and stay tuned to Meme Insider for the latest updates.
Remember, this isn't financial advice—always DYOR (do your own research) and trade responsibly. The crypto world moves fast, and patterns like these help us navigate it better. What's your take on this cycle? Drop a comment below!


