If you're keeping an eye on the crypto world, especially how traditional finance is dipping its toes in, the latest update on Bitcoin and Ethereum ETFs is worth a look. According to on-chain analysis firm Lookonchain's recent post on X (view the original tweet here), we're seeing some notable shifts in net flows for these spot ETFs as of early September 2025. Let's break it down in simple terms—ETFs, or Exchange-Traded Funds, are like baskets of assets that trade on stock exchanges, making it easier for investors to get exposure to Bitcoin (BTC) and Ethereum (ETH) without holding the coins directly.
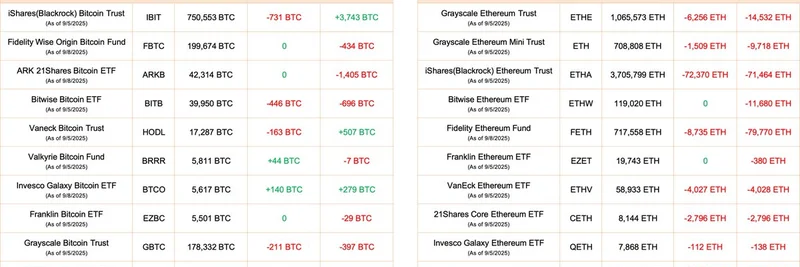
The data covers 10 Bitcoin ETFs and 9 Ethereum ETFs, showing daily and weekly net inflows or outflows. Net inflow means more money coming in (buying pressure), while outflow indicates selling or redemptions. Here's the visual from Lookonchain that captures it all:
Key Insights from Bitcoin ETF Flows
Starting with Bitcoin, the overall picture is mixed. The total holdings across these ETFs stand at a whopping 1,291,855 BTC, valued at about $145.41 billion. But on a one-day basis (as of September 5, 2025), there was a net outflow of 1,411 BTC, equating to roughly $158.8 million leaving the funds. Over the past seven days, though, it's a slight positive with a net inflow of 1,856 BTC ($208.8 million).
Blackrock's iShares Bitcoin Trust (IBIT) leads the pack in holdings with 750,553 BTC ($84.48 billion) but saw the biggest daily outflow at 731 BTC ($126.37 million). Other notable ones include Fidelity's FBTC holding steady with no daily change but a seven-day outflow, and Grayscale's GBTC continuing its trend of outflows. On the flip side, funds like VanEck's HODL and Invesco's BTCO showed small inflows.
This suggests institutional investors are a bit cautious short-term but still accumulating over the week. For meme token enthusiasts, Bitcoin's stability often sets the tone for the entire market—when BTC holds strong, altcoins and memes can thrive on the hype.
| Bitcoin ETF Name | Ticker | BTC Holdings | 1D Net Inflow | 7D Net Inflow |
|---|---|---|---|---|
| iShares (Blackrock) Bitcoin Trust | IBIT | 750,553 BTC | -731 BTC | +3,743 BTC |
| Fidelity Wise Origin Bitcoin Fund | FBTC | 199,674 BTC | 0 | -434 BTC |
| ARK 21Shares Bitcoin ETF | ARKB | 42,314 BTC | 0 | -1,405 BTC |
| Bitwise Bitcoin ETF | BITB | 39,950 BTC | -446 BTC | -696 BTC |
| VanEck Bitcoin Trust | HODL | 17,287 BTC | -163 BTC | +507 BTC |
| Valkyrie Bitcoin Fund | BRRR | 5,811 BTC | +44 BTC | -7 BTC |
| Invesco Galaxy Bitcoin ETF | BTCO | 5,617 BTC | +140 BTC | +279 BTC |
| Franklin Bitcoin ETF | EZBC | 5,501 BTC | 0 | -29 BTC |
| Grayscale Bitcoin Trust | GBTC | 178,332 BTC | -211 BTC | -397 BTC |
| Grayscale Bitcoin Mini Trust | BTC | 46,816 BTC | -44 BTC | +295 BTC |
| Total | - | 1,291,855 BTC | -1,411 BTC | +1,856 BTC |
(Values in parentheses are approximate USD equivalents based on current prices.)
Ethereum ETF Flows: Heavier Outflows
Ethereum tells a different story, with more pronounced outflows. Total holdings are at 6,411,448 ETH ($27.99 billion). The one-day net outflow was a hefty 95,805 ETH ($418.19 million), and over seven days, it's even larger at 194,506 ETH ($849.02 million) leaving the funds.
Again, Blackrock's iShares Ethereum Trust (ETHA) is the heavyweight, holding 3,705,799 ETH ($16.18 billion) but experiencing massive outflows: 72,370 ETH ($315.9 million) in one day alone. Grayscale's trusts (ETHE and ETH) also saw significant redemptions, with ETHE outflowing 6,256 ETH daily. Funds like Bitwise (ETHW) and Franklin (EZET) held steady with no daily changes, but the overall trend is downward.
Ethereum's price can be more volatile, influenced by network upgrades and DeFi activity. For those in the meme token space, which often builds on Ethereum or layer-2 solutions, these outflows might signal reduced institutional interest, potentially pressuring ETH-based meme coins like PEPE or SHIB in the short term.
| Ethereum ETF Name | Ticker | ETH Holdings | 1D Net Inflow | 7D Net Inflow |
|---|---|---|---|---|
| Grayscale Ethereum Trust | ETHE | 1,065,573 ETH | -6,256 ETH | -14,532 ETH |
| Grayscale Ethereum Mini Trust | ETH | 708,808 ETH | -1,509 ETH | -9,718 ETH |
| iShares (Blackrock) Ethereum Trust | ETHA | 3,705,799 ETH | -72,370 ETH | -71,464 ETH |
| Bitwise Ethereum ETF | ETHW | 119,020 ETH | 0 | -11,660 ETH |
| Fidelity Ethereum Fund | FETH | 717,558 ETH | -8,735 ETH | -79,770 ETH |
| Franklin Ethereum ETF | EZET | 19,743 ETH | 0 | -380 ETH |
| VanEck Ethereum ETF | ETHV | 58,933 ETH | -4,027 ETH | -4,028 ETH |
| 21Shares Core Ethereum ETF | CETH | 8,144 ETH | -2,796 ETH | -2,796 ETH |
| Invesco Galaxy Ethereum ETF | QETH | 7,868 ETH | -112 ETH | -158 ETH |
| Total | - | 6,411,448 ETH | -95,805 ETH | -194,506 ETH |
(USD equivalents in parentheses.)
What Does This Mean for Meme Tokens and Blockchain Practitioners?
As someone who's covered crypto from the editorial desk at CoinDesk and now diving deep into meme culture here at Meme Insider, I see these ETF flows as a barometer for broader market sentiment. Bitcoin's modest weekly inflows could provide a floor for prices, benefiting BTC-correlated memes. But Ethereum's consistent outflows might reflect concerns over scalability or competition from faster chains like Solana, where many viral memes launch.
If you're a blockchain practitioner or meme token creator, keep an eye on these trends—they influence liquidity and investor appetite. Tools like Lookonchain help track on-chain movements, giving you an edge in spotting smart money shifts. For more insights on how ETF dynamics ripple into the meme ecosystem, check out our knowledge base on meme token market impacts.
Stay tuned for more updates, and remember, in crypto, flows can change fast—always DYOR (do your own research)!

