In the fast-paced world of cryptocurrency, keeping an eye on macro trends can make all the difference. Recently, crypto commentator and macro analyst MartyParty shared a compelling chart on X (formerly Twitter) that highlights how Bitcoin's high timeframe movements are closely following global liquidity patterns. Posted on October 6, 2025, this analysis has sparked discussions among traders and enthusiasts alike. Let's break it down in simple terms and explore its potential ripple effects on meme tokens.
Understanding the Chart: Bitcoin and Global Liquidity
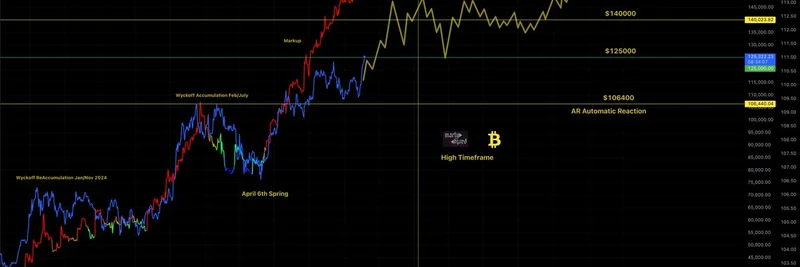
At first glance, the chart shows Bitcoin's price (in blue, red, and green lines) plotted against global liquidity (in yellow). Global liquidity refers to the total amount of money circulating in the world's financial systems, influenced by central banks' policies like quantitative easing or tightening. When liquidity increases, it often fuels asset prices, including cryptocurrencies.
MartyParty points out key phases using the Wyckoff Method, a classic technical analysis framework named after trader Richard Wyckoff. This method identifies accumulation (buying up assets quietly), markup (price rising), distribution (selling off), and markdown (price falling). In the chart:
- Wyckoff Reaccumulation (Jan/Nov 2024): This marks a period where big players (often called "smart money") were buying Bitcoin after a dip, setting the stage for future gains.
- April Spring: A brief fake-out drop that tests support levels before a rebound.
- Markup Phase: The steady upward trend as prices climb.
- Wyckoff Reaccumulation (Feb/July): Another buildup phase.
- Wyckoff Reaccumulation (September 2025): The most recent one, suggesting accumulation is happening now.
The chart projects Bitcoin potentially reaching highs like $164,000 or even $150,000+ by early 2026, driven by rising global liquidity. It starts from January 2024, when monetary policy shifts began, and extends into 2027. The correlation is striking—Bitcoin's peaks and troughs mirror liquidity fluctuations almost perfectly.
For those new to this, think of global liquidity as the fuel in the crypto engine. When central banks pump more money into the economy (like during economic recoveries), it flows into riskier assets like BTC. This isn't just theory; historical data from sources like TradingView often shows similar patterns.
Why This Matters for Meme Coins
While the chart focuses on Bitcoin, the king of crypto, its movements have a massive trickle-down effect on the entire market, especially meme tokens. Meme coins like Dogecoin or newer ones on Solana and Ethereum often ride Bitcoin's waves. When BTC surges due to increased liquidity, altcoins—including memes—tend to follow with even more volatility.
For instance, during past bull runs fueled by liquidity injections (think 2021's post-COVID stimulus), meme coins exploded in value. If MartyParty's analysis holds, we could see a similar scenario in late 2025 and 2026. This means opportunities for meme token traders, but also risks—reaccumulation phases can involve shakeouts where weak hands sell off.
At Meme Insider, we track how these macro signals influence the meme ecosystem. Tokens tied to viral trends or communities could benefit from a liquidity-driven BTC pump, potentially leading to new all-time highs. However, always remember: this is educational content, not financial advice. DYOR (do your own research) before diving in.
Broader Implications for Blockchain Practitioners
Beyond price action, this ties into larger blockchain trends. Increased global liquidity could accelerate adoption of decentralized finance (DeFi) and Web3 projects, many of which underpin meme tokens. For developers and investors, understanding these cycles helps in timing launches or investments.
MartyParty's tweet has garnered over 8,500 views and positive replies, with users like Crypto Joe echoing that "Bitcoin is headed higher along with Global Liquidity." It's a reminder that in crypto, macro awareness is key to navigating the noise.
If you're into meme tokens, keep an eye on how BTC's trajectory plays out. Tools like CoinMarketCap or DexScreener can help monitor correlations in real-time. Stay tuned for more updates on how these trends shape the meme landscape!
