Hey there, crypto enthusiasts! If you’ve been keeping an eye on Bitcoin lately, you might have noticed some interesting chatter on X. One post that’s been catching attention comes from MartyParty, who dropped a fascinating analysis on August 1, 2025, about how Bitcoin’s high timeframe follows global liquidity. Let’s break it down in a way that’s easy to digest, especially if you’re new to the world of crypto trading or the Wyckoff method.
What’s the Buzz About?
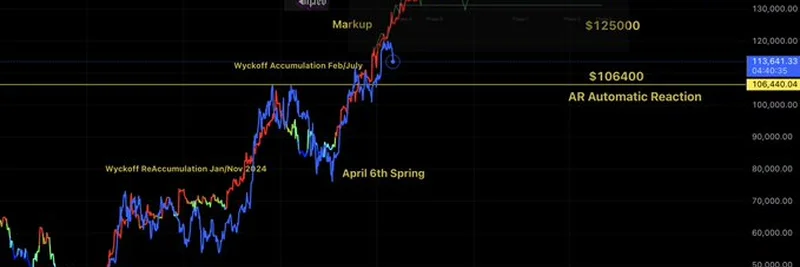
MartyParty’s post highlights a chart showing Bitcoin’s price action, overlaid with a Wyckoff analysis framework. For those unfamiliar, the Wyckoff method is a technical analysis approach developed by Richard Wyckoff in the early 20th century. It helps traders predict price movements by identifying phases like accumulation, markup, and distribution. In this case, the chart tracks Bitcoin from January 2024, pointing to a potential reaccumulation phase from August to December 2025.
The standout takeaway? Bitcoin’s price seems to lag global liquidity by about 12 weeks. Marty notes this retracement happened before the U.S. issues new liquidity, suggesting a possible bullish trend ahead. The chart marks key levels like $106,400 (an automatic reaction) and a potential climb to $125,000 or even $140,000 during the Wyckoff reaccumulation phase.
Breaking Down the Chart
Let’s walk through the juicy details:
- Wyckoff Accumulation (Feb-July 2024): This phase shows Bitcoin consolidating after a dip, where big players (often called "smart money") are quietly buying up coins.
- April 6th Spring: A critical moment where the price briefly dropped below support (a "spring" in Wyckoff terms) to shake out weak hands, only to bounce back—hinting at accumulation.
- Markup Phase: The upward climb starts here, with the price pushing toward $125,000.
- Wyckoff Reaccumulation (Aug-Dec 2025): This is the current focus, suggesting another period of consolidation before a potential breakout to $140,000.
The chart also ties these movements to global liquidity, a measure of money supply that often fuels asset prices. If liquidity is indeed rising, Bitcoin could ride that wave, especially with the 12-week lag Marty mentions.
Why Should You Care?
For blockchain practitioners and meme token enthusiasts (yes, even us at Meme Insider!), understanding Bitcoin’s trends can offer valuable insights. Bitcoin often sets the tone for the broader crypto market, including those wild meme tokens we love. If Marty’s analysis holds, we might see a bullish market that could lift altcoins and even niche projects. Plus, the Wyckoff method’s focus on "smart money" moves can help you spot opportunities before the crowd jumps in.
What’s Next?
Marty’s note about U.S. liquidity injections adds an extra layer of intrigue. If new money enters the system, it could amplify Bitcoin’s upward trajectory. Keep an eye on macroeconomic news and pair it with technical analysis like this to stay ahead. Whether you’re a trader or just a curious crypto fan, this could be a signal to watch closely as we move through August 2025.
Got thoughts on this? Drop them in the comments or share your own analysis. And if you’re into meme tokens or want to dive deeper into crypto trends, stick with us at Meme Insider for more updates and insights!