In the ever-evolving world of cryptocurrency, keeping an eye on Bitcoin's big-picture movements is crucial, especially since it often sets the tone for altcoins and meme tokens alike. Today, on August 17, 2025, crypto analyst and commentator MartyParty (@martypartymusic) dropped an intriguing chart on X that ties Bitcoin's high timeframe price action directly to global liquidity trends. If you're into meme coins, this could signal upcoming opportunities—or pitfalls—in the market.
Understanding the Chart: Bitcoin and Global Liquidity
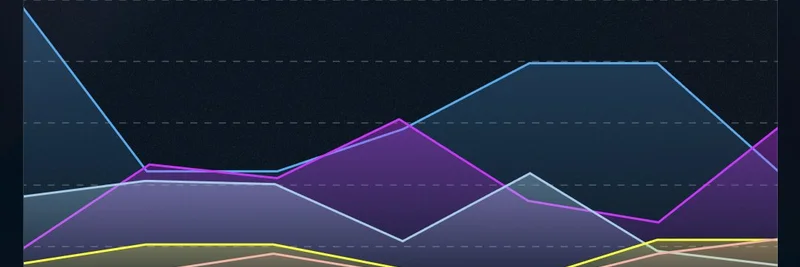
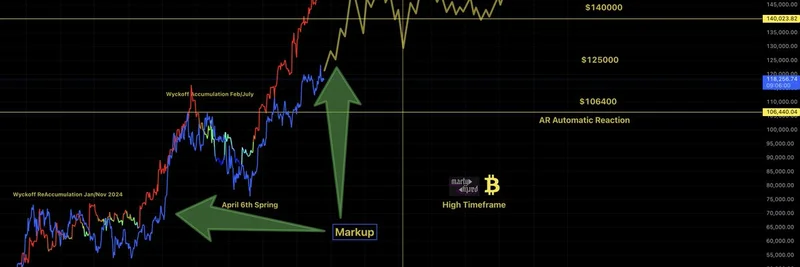
At first glance, the chart maps out Bitcoin's price trajectory from early 2024 through projected levels into 2026, overlaid with global liquidity measures. Global liquidity refers to the total amount of money sloshing around in the world's financial systems—think central bank balance sheets, money supply, and easy credit. When liquidity rises, risk assets like Bitcoin tend to pump; when it tightens, things can get shaky.
MartyParty highlights how Bitcoin has been following this liquidity wave, with key annotations pointing to Wyckoff re-accumulation phases. For those new to the term, the Wyckoff Method is a classic technical analysis framework developed by Richard Wyckoff in the early 20th century. It breaks down market cycles into phases where "smart money" (big institutions) accumulates assets quietly before driving prices up in a markup phase.
In this chart:
- **Early
🔍 Connecting to meme tokens
- The site meme-insider.com focuses on meme tokens, so link Bitcoin's movement to meme coin impacts.
2024**: Marks the start of a monetary policy shift, kicking off an initial Wyckoff re-accumulation. - Jan/Nov 2024: More re-accumulation, building the base.
- Feb/July 2025: Continued accumulation amid volatility.
- September 2025: Another re-accumulation phase.
- April 6th Spring: A "spring" action—a fakeout dip that tests support before a breakout.
- Markup Phase: The green arrow points to an expected upward surge, pushing Bitcoin toward highs around $180,000 by mid-2026.
- AR Automatic Reaction: Labeled on the right, indicating potential pullbacks or reactions in higher timeframes.
The chart also projects Bitcoin hitting peaks like $164,000, with liquidity lines trending upward.
MartyParty's Projections and Warnings
In the accompanying notes, MartyParty adds his personal take: "My projections added and expected markup indicated." He warns of a possible drawdown toward the end of Q4 2025 during the Wyckoff re-accumulation. This could mean a sharp 50% pullback to around $120,000, depending on macroeconomic factors like interest rate cuts. However, he's optimistic, suggesting it might be shallower—to $130,000—followed by a quick "V-shaped" recovery to $150,000+, which could wrong-foot many traders.
This aligns with broader crypto narratives where Bitcoin's halvings and liquidity injections from events like ETF approvals or policy easing drive cycles. As of today, Bitcoin is hovering in a range, but if global liquidity keeps expanding (as the chart suggests), we could see that markup phase ignite.
Implications for Meme Tokens and the Crypto Ecosystem
While this analysis focuses on Bitcoin, it's gold for meme coin enthusiasts. Meme tokens thrive on market euphoria, and Bitcoin rallies often trigger "altseason"—where capital flows from BTC into riskier assets like Dogecoin, Shiba Inu, or emerging memes on Solana and Base. If MartyParty's projections hold, a Bitcoin push to $150,000+ could supercharge meme coin volumes, creating viral pumps and new narratives.
But beware the pullbacks: A 50% Bitcoin dip might cascade into meme markets, wiping out leveraged positions and testing community resilience. For blockchain practitioners, this underscores the importance of understanding macro ties—tools like the Wyckoff Method can help spot accumulation zones for memes too.
If you're tracking this, check out the original tweet for real-time discussions in the replies. MartyParty's insights blend macro analysis with crypto specifics, making them a must-follow for anyone building in this space.
Stay tuned to Meme Insider for more breakdowns on how big-picture trends like these ripple into the meme token world. What's your take on Bitcoin's next move?