Hey there, crypto enthusiasts! If you’ve been keeping an eye on Bitcoin lately, you’ve probably noticed some exciting movements. On July 25th, 2025, Marty Party, a well-known figure in the crypto space, dropped a fascinating thread on X that’s got everyone talking. This analysis dives into Bitcoin’s high timeframes and ties its price action to global liquidity trends. Let’s break it down in a way that’s easy to digest, even if you’re new to the crypto game!
What’s the Buzz About?
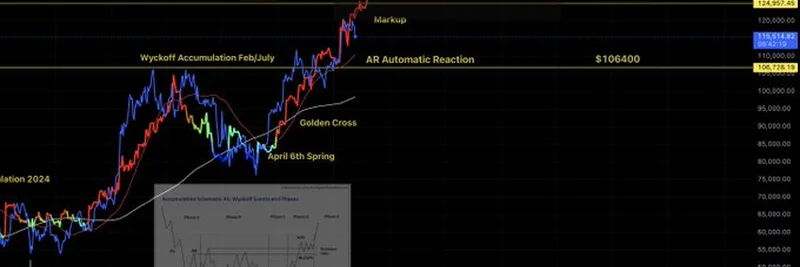
Marty’s post features a detailed chart that tracks Bitcoin’s price alongside global liquidity. The chart highlights a few key moments:
- Wyckoff Accumulation Phases: These are stages where Bitcoin is believed to be building up strength before a big move. Marty points out accumulation periods from February to July and again from August to December.
- Golden Cross and April 6th Spring: A "Golden Cross" happens when a short-term moving average crosses above a long-term one, often signaling a bullish trend. The "April 6th Spring" marks a bounce back after a dip, suggesting buyers stepped in.
- Markup and AR Automatic Reaction: The "Markup" phase shows Bitcoin’s price climbing, while the "AR Automatic Reaction" indicates a pullback that’s part of the natural cycle.
The chart also overlays global liquidity (shown as a red line) with Bitcoin’s price (in blue), suggesting that the two move in sync. Marty simplifies it for us: “The blue line is following the red line.” In other words, when global liquidity increases, Bitcoin tends to rise too!
Why Global Liquidity Matters
So, what’s global liquidity? Think of it as the amount of money flowing through the world’s economies, controlled by central banks. When there’s more money available, people often invest in “risk assets” like Bitcoin, driving up its price. Marty’s chart shows Bitcoin hitting $140,000 after a liquidity pullback, hinting at a strong correlation. This isn’t just a wild guess—studies, like those from Lyn Alden, suggest Bitcoin follows global liquidity about 83% of the time over a 12-month period.
Key Trading Patterns to Watch
Marty’s analysis isn’t just about liquidity—it’s packed with trading insights. Here are some patterns you might spot:
- Wyckoff Method: This is a strategy that identifies accumulation and distribution phases. The chart shows Bitcoin moving through these phases, setting the stage for a breakout.
- Golden Cross: As mentioned, this is a bullish signal. If you see this on your own charts, it might be a good time to consider buying.
- Automatic Reaction (AR): After a big move up, prices often pull back. This is normal and can offer a chance to jump in at a lower price.
These patterns are gold for traders looking to time the market. The inset chart even breaks down the Wyckoff phases (A through E), giving a roadmap of what to expect.
What Does This Mean for 2025?
Marty’s prediction of Bitcoin reaching $140,000 is bold but aligns with other bullish forecasts. For instance, analysts like Tom Lee from CNBC have thrown out a $250,000 target for 2025, driven by institutional adoption and market cycles. With global liquidity potentially fueling this growth, it’s an exciting time to watch Bitcoin. However, as one X user pointed out, short-term dips could trap over-leveraged traders, so caution is key.
Community Reactions
The thread sparked a lively discussion:
- Some users, like @BobaCrypto424, warned of short-term downsides, suggesting a trap for late buyers.
- Others, like @suircra, got hyped with “to the moon” memes, reflecting the optimism.
- @wizz_trades raised a skeptic’s eyebrow, questioning if global liquidity is just a convenient excuse for every dip.
This mix of excitement and skepticism shows how divisive Bitcoin predictions can be—perfect fuel for a meme coin rally, if you ask me!
Wrapping Up
Marty Party’s July 25th, 2025, thread offers a treasure trove of insights for Bitcoin fans. By linking global liquidity to price surges and highlighting key trading patterns, it’s a must-read for anyone navigating the crypto waters. Whether you’re a seasoned trader or just dipping your toes in, keeping an eye on these trends could pay off. What do you think—will Bitcoin hit $140,000 or beyond? Drop your thoughts in the comments, and stay tuned to meme-insider.com for more crypto updates!

