Hey there, crypto enthusiasts! If you're knee-deep in the world of blockchain and meme tokens, you've probably got your eyes glued to Bitcoin's every move. After all, when BTC sneezes, the whole market catches a cold—or in this case, gears up for a feverish bull run. A recent tweet from renowned crypto analyst TechDev_52 has the community buzzing, highlighting a liquidity signal that's been spot-on five times before. Let's break it down and see what it could mean for your favorite meme coins.
Understanding TechDev_52's Liquidity Signal
TechDev_52, a sharp-minded entrepreneur and Bitcoin analyst, shared a chart on X (formerly Twitter) that's got everyone talking. The signal in question tracks global liquidity—think of it as a measure of how much money is sloshing around in the world's financial systems, like M2 money supply from major economies. He uses technical indicators, such as monthly MACD bull crosses and Vortex crossovers on a global liquidity proxy that cycles every 3.5 years or so.
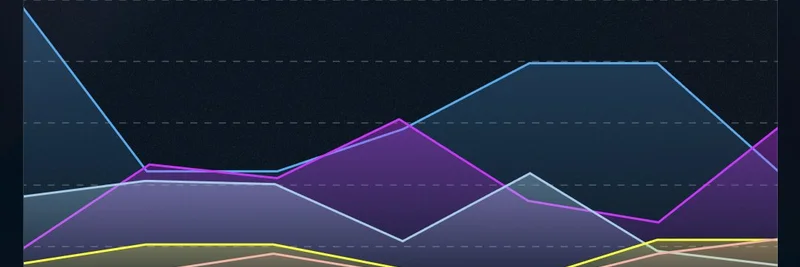
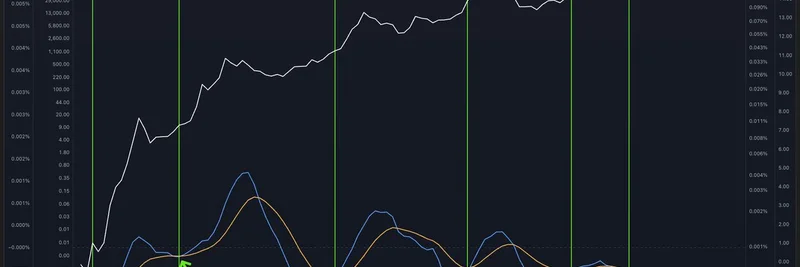
In simple terms, this isn't just random lines on a graph. The chart shows a white line representing rising liquidity levels over time, with orange and blue oscillators below pinpointing momentum shifts. Those green arrows? They mark the "signals"—moments when liquidity momentum bottoms out and turns upward. Historically, each of these has kicked off a massive Bitcoin rally.
According to TechDev, this signal is "5 for 5" in launching Bitcoin to new heights, with the price at least doubling every single time. Past instances have led to gains like 10x over four months, 12x over ten months, and 6x over six months. The latest one—the sixth—just fired, suggesting we're on the cusp of another big move.
For context, TechDev has been tracking this for years. Back in 2023, he noted similar patterns preceding Bitcoin's all-time highs, emphasizing that these signals often outperform even halving events in predictive power. You can check out the original tweet here for the full vibe.
Historical Hits: Why This Signal Matters
Let's geek out on the history for a sec. This liquidity proxy oscillates in roughly 3.5-year cycles, aligning with Bitcoin's major impulses. The three-prong confirmation—breaking above a 20-month moving average, plus those MACD and Vortex crosses—has nailed the start of BTC's four previous all-time high runs.
- Signal 1 (around 2011): Kicked off early Bitcoin adoption phase, leading to exponential growth.
- Signal 2 (mid-2015): Post-bear market, BTC doubled and then some, setting up the 2017 bull.
- Signal 3 (late 2018): After the crypto winter, BTC surged to $69K in 2021.
- Signal 4 (2022): Marked the bottom, paving the way for recent recoveries.
- Signal 5 (early 2023): Continued upward momentum amid ETF approvals.
Each time, Bitcoin didn't just inch up—it exploded, often multiplying in value within months. Replies to TechDev's tweet echo the excitement: one user called it "100% historical hit rate," while another predicted "the greatest 6 months ever in crypto." If history rhymes, we're looking at BTC potentially hitting $120K or higher from current levels around $60K.
How This Ties into Meme Tokens
Now, why should meme token fans care? Meme coins like Dogecoin (DOGE), Shiba Inu (SHIB), Pepe (PEPE), and newer entrants thrive on hype, liquidity, and Bitcoin's coat-tails. When BTC pumps, altcoins—and especially memes—often see even wilder gains due to their speculative nature.
In past bull runs triggered by similar signals:
- DOGE went parabolic in 2021, turning small bets into fortunes.
- SHIB exploded with "Shibarmy" fervor, fueled by abundant liquidity.
- Newer memes like PEPE rode the wave in 2023, minting millionaires overnight.
With global liquidity turning positive—think Fed rate cuts, stimulus packages, and crypto ETFs sucking in institutional cash—this signal could flood the market with fresh capital. Meme tokens, being high-beta plays (they amplify market moves), stand to benefit massively. Imagine a doubled BTC price drawing in retail investors, who then FOMO into memes for quick flips.
But a word of caution: memes are volatile. While this signal has a perfect track record for BTC doubles, nothing's guaranteed. Always DYOR and manage risk—don't bet the farm on a chart alone.
What to Watch Next
Keep an eye on macro indicators like China's 10-year yield (another TechDev favorite) and overall crypto sentiment. If liquidity keeps expanding, we could see meme token seasons heat up by Q4 2025. For blockchain practitioners building in this space, this is prime time to innovate—perhaps launching liquidity pools or meme-themed DeFi projects to capitalize on the influx.
TechDev's insights remind us that crypto isn't just about memes and moonshots; it's intertwined with global finance. Whether you're holding DOGE for the lols or stacking sats seriously, signals like this could shape the next chapter. What's your take—bullish on memes? Drop a comment below!
Stay tuned to Meme Insider for more breakdowns on how macro trends affect your portfolio. If you enjoyed this, share it with your crypto crew. 🚀