If you’ve been keeping an eye on the crypto world, you’ve probably seen Marty Party’s latest tweet thread from August 9, 2025. This popular analyst dropped some intriguing insights about Bitcoin’s high timeframe trends, and it’s got everyone talking. Let’s break it down in a way that’s easy to digest, even if you’re new to the crypto game.
What’s the Buzz About?
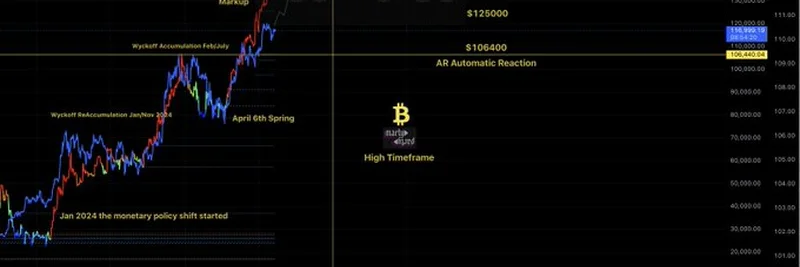
Marty Party shared a detailed chart showing Bitcoin’s price action alongside global liquidity trends. The chart highlights key phases like the Wyckoff Accumulation (February-July 2024), Markup, and an Automatic Reaction (AR) phase. For those unfamiliar, Wyckoff is a trading method that identifies accumulation (when smart money buys in) and markup (when prices start climbing). The AR phase often signals a pause or pullback before the next big move.
The standout point? Bitcoin’s price could be gearing up for a significant run, potentially hitting $165,000, especially with global liquidity still on the rise. Marty notes that the U.S. hasn’t even rolled out stimulus or rate cuts yet, which could supercharge this trend.
Global Liquidity: The Hidden Driver
One of the coolest parts of this analysis is the global liquidity chart. It shows how the money supply from major central banks is trending upward, recently hitting 96.37T (trillion). This is a big deal because more money floating around often pushes investors toward “risk assets” like Bitcoin. Think of it as extra cash in people’s pockets, looking for a home—and Bitcoin’s looking pretty cozy right now.
The chart also marks an all-time high (ATH) and suggests we’re not done climbing. If the U.S. announces rate cuts or stimulus packages, as Marty hints, this could mean even more fuel for Bitcoin’s fire.
Why High Timeframe Matters
Marty emphasizes a “high timeframe” approach, which means looking at the bigger picture—think months or years, not days. This perspective helps filter out the noise of short-term price swings and focuses on long-term trends. The chart shows Bitcoin breaking out of accumulation phases and heading toward new highs, with a potential target of $165,000 by January 2026. That’s a bold call, but the data backs it up with historical patterns.
What Does This Mean for You?
If you’re a blockchain enthusiast or just dipping your toes into crypto, this analysis offers a few takeaways. First, patience is key—several replies to Marty’s thread, like from @333blacksea, echo this with a minimalist chart reminding us that annoyances are lessons in waiting. Second, keep an eye on monetary policy shifts. A rate cut could be the spark that sends Bitcoin soaring.
For meme token fans (hey, we’re Meme Insider after all!), this could also mean a ripple effect. When Bitcoin pumps, altcoins and even meme coins often ride the wave. So, while this thread focuses on Bitcoin, it might be worth watching how tokens like Dogecoin or Shiba Inu react.
The Bottom Line
Marty Party’s August 2025 thread is a goldmine for anyone trying to understand where Bitcoin might be headed. With global liquidity on the rise and potential U.S. policy changes on the horizon, the stage could be set for a bullish run. Whether you’re hodling Bitcoin or exploring the wild world of meme tokens, staying informed with analyses like this can give you an edge.
What do you think? Are you betting on Bitcoin hitting $165,000, or do you see other trends shaping the market? Drop your thoughts in the comments—we’d love to hear from you!