The Federal Reserve just dropped a bombshell that's got the crypto world buzzing: quantitative tightening (QT) is officially over. If you're holding Bitcoin and wondering if it's time to pop the champagne, hold your horses. A sharp-eyed analyst from Counterparty Research is reminding us that while BTC reacts lightning-fast to bad news, it plays the long game when liquidity starts flowing back in.
In a recent X post, Adam from Counterparty shared a telling chart that overlays Bitcoin's price movements against the Fed's balance sheet size from 2017 to late 2025. The visual is crystal clear: during QT phases—when the Fed shrinks its balance sheet by selling assets—Bitcoin dumps hard and quick. But when the spigot turns the other way and the balance sheet expands? That's when things get interesting... and slow.
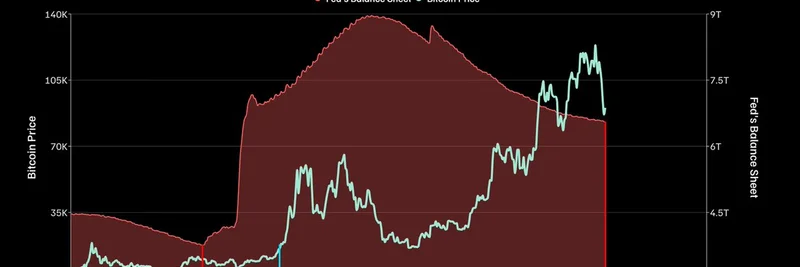
The Chart Tells the Story
Take a look at that graph. The red line tracing the Fed's balance sheet balloons during the 2020-2021 bull run, peaking around $9 trillion as pandemic stimulus kicked in. Bitcoin? It skyrocketed in tandem, smashing through $60K. Fast-forward to the QT era starting in 2022, and both lines nosedive—the Fed's sheet contracting to about $7 trillion, BTC cratering to sub-$20K lows.
But here's the kicker: the last time QT wrapped up in 2019, Bitcoin didn't just moon immediately. It took a whopping 59 weeks—over a year—for the price to break out and start its climb. Why the lag? Markets need time to reposition. Investors shake off the fear, institutions rebuild exposure, and liquidity trickles through the system before igniting real momentum.
Adam's take? "QT is officially ending but be patient with your bags." He's quoting a viral alert from Watcher.Guru that broke the news, emphasizing that Bitcoin leads the pain but trails the gain.
What Does QT's End Mean for Crypto?
For the uninitiated, quantitative tightening is the Fed's way of pumping the brakes on the economy by reducing its holdings of bonds and other assets. It's the opposite of quantitative easing (QE), where they buy up assets to inject cash into the system. Ending QT signals a pivot toward easier money—potentially more liquidity for risk assets like stocks, and yes, cryptocurrencies.
In crypto terms, this could be bullish. More Fed liquidity often correlates with higher risk appetite, and Bitcoin has long been seen as a hedge against fiat debasement. But as the chart highlights, don't expect overnight miracles. The 2019 precedent suggests we're in for a waiting game, possibly through mid-2026 if history rhymes.
Replies to Adam's post echo this sentiment. One trader noted, "In 2019 the breakout took over a year because positioning needed time to rebuild. This cycle might rhyme more than people expect." Another quipped, "Patience ain't just a virtue, it's the secret sauce for max gains when the market flips."
Lessons for Meme Token Hunters and Blockchain Pros
At Meme Insider, we're all about spotting those viral, community-driven tokens that capture the zeitgeist—like Dogecoin's Elon-fueled pumps or PEPE's frog-meme frenzy. But even in the wild world of memes, macro forces matter. A Fed pivot could supercharge altcoin seasons, where meme tokens often outperform BTC. Just remember: while Bitcoin lags the balance sheet expansion, memes can lag even further... or explode unpredictably.
If you're a blockchain practitioner building dApps or DeFi protocols, this is your cue to stress-test for liquidity surges. More cheap money means more users, more volume, and bigger opportunities—but also volatility.
Stack Sats and Stay Patient
Bottom line? The Fed's QT exit is a green light, but Bitcoin's chart history screams "patience." If you're HODLing, use this time to DCA (dollar-cost average) into BTC or your favorite under-the-radar memes. Track the balance sheet weekly via tools like FRED for real-time updates.
What do you think—will this cycle buck the trend with a faster breakout? Drop your takes in the comments. And if you're hunting the next 100x meme gem, subscribe to Meme Insider for daily alpha straight to your inbox.
Stay salty, stay savvy.