Hey there, crypto enthusiasts! If you’ve been keeping an eye on the Bitcoin market, you’ve probably seen some exciting chatter on X lately. One post that’s got everyone talking comes from MartyParty (@martypartymusic), who dropped a fascinating high timeframe analysis on August 10, 2025. This chart suggests Bitcoin could be heading toward a whopping $140,000, driven by global liquidity trends. Let’s break it down and see what this means for the future of BTC!
What’s the Buzz About?
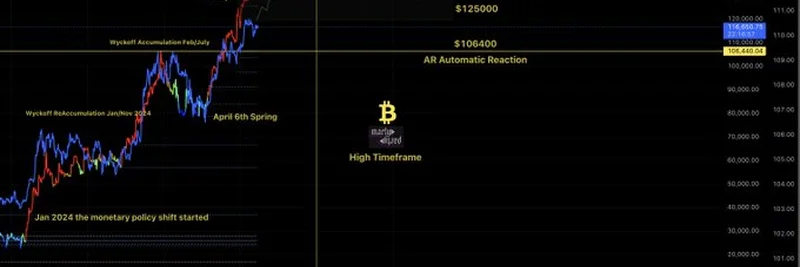
MartyParty’s tweet features a detailed chart that tracks Bitcoin’s price movements alongside global liquidity. The image shows a clear correlation between the two, with key price levels marked out—like $106,400 (AR Automatic Reaction) and $125,000 (Wyckoff Reaccumulation Aug/Dec). The big prediction? Bitcoin could follow the "blue line" (global liquidity) to hit $140,000, especially as we approach January 2026.
For those new to this, global liquidity refers to the amount of money flowing through the world’s financial systems, often influenced by central banks. When liquidity increases, investors tend to pour money into "risk assets" like Bitcoin, potentially driving up its price. Marty’s chart highlights how past Bitcoin bull runs, like the "April 6th Spring" and "Markup" phases, align with these liquidity spikes.
Breaking Down the Chart
Let’s dive into the juicy details of this chart:
- Wyckoff Patterns: The chart uses Wyckoff analysis, a trading method that identifies accumulation and reaccumulation phases. These are periods where smart money (big investors) quietly builds positions before a big price move. Marty marks several of these, including a Wyckoff Reaccumulation from January to November 2024 and another from August to December 2025.
- Global Liquidity Line: The blue line represents global liquidity, which has been trending upward. It’s currently at $165,000, with historical peaks aligning with Bitcoin’s past highs.
- High Timeframe: This term refers to a long-term view of the market, often using weekly or monthly data. Marty’s focus on this suggests a sustained upward trend rather than a short-term spike.
- Monetary Policy Shift: The chart notes a shift starting in January 2024, likely referring to changes in central bank policies that could be fueling this liquidity surge.
Why $140K? The Logic Behind the Prediction
So, why does Marty think Bitcoin could hit $140,000? The idea hinges on the historical relationship between Bitcoin and global liquidity. When more money floods the system, investors often turn to cryptocurrencies as a hedge against inflation or a store of value. The chart shows Bitcoin following this liquidity trend closely, with past peaks like $106,400 and $125,000 acting as stepping stones.
If this pattern holds, the next target could indeed be $140,000 by early 2026. Of course, this isn’t a guarantee—crypto markets are notoriously volatile, and external factors like regulation or economic downturns could throw a wrench in the plan.
What the Community Thinks
The X thread shows a mix of excitement and skepticism. Some users, like @Stackedd123, are optimistic, predicting $140-$150K by September 2025. Others, like @jimKelvinto, are cautiously watching to see how it plays out. There’s also a bit of hype, with memes and trading group invites popping up—classic crypto Twitter vibes!
Should You Jump In?
Before you go all-in on Bitcoin based on this analysis, a word of caution: crypto trading is risky. Marty’s chart is a great tool for understanding long-term trends, but it’s not financial advice. If you’re intrigued, consider doing your own research or consulting a financial expert. Tools like meme-insider.com can also help you stay updated on market trends, including meme tokens and broader crypto news.
Final Thoughts
MartyParty’s high timeframe analysis offers an exciting glimpse into Bitcoin’s potential future, tying it to the ebb and flow of global liquidity. Whether Bitcoin hits $140,000 or not, this chart underscores the importance of watching macroeconomic factors in the crypto space. Keep an eye on those liquidity trends, and who knows? You might just catch the next big wave!
What do you think about this prediction? Drop your thoughts in the comments, and let’s chat about where Bitcoin is headed next!