Hey there, crypto enthusiasts! If you’ve been scrolling through X lately, you might have stumbled upon an intriguing post by MartyParty that’s got the Bitcoin community buzzing. Posted on August 7, 2025, MartyParty shared a bold prediction: Bitcoin could soar to $140,000, thanks to its correlation with global liquidity. Let’s dive into this chart-based analysis and break it down in a way that’s easy to understand—even if you’re new to the crypto game!
The Chart That Started It All
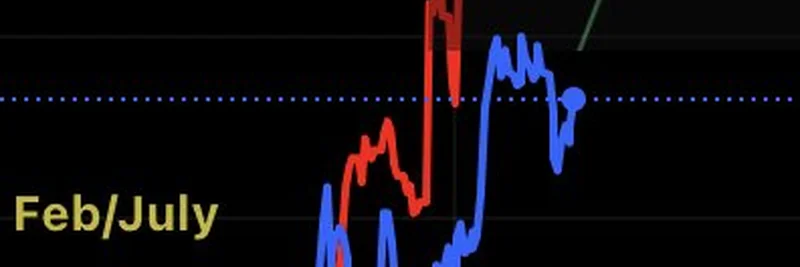
MartyParty’s post includes a fascinating chart that compares Bitcoin’s price movements (in red) with a 12-week lagged global liquidity index (in blue). Check it out:
The chart highlights a few key points:
- The red line shows Bitcoin’s price trajectory, with a noticeable “markup” phase (an upward trend) followed by a 50% pullback.
- The blue line, representing global liquidity with a 12-week delay, seems to mirror these movements.
- The “Feb/July” marker suggests a significant turning point, possibly indicating a seasonal or economic shift.
MartyParty argues that this correlation is no coincidence and predicts a climb to $140K if the trend holds.
What’s Global Liquidity, Anyway?
For those unfamiliar, global liquidity refers to the amount of money flowing through the world’s financial systems—think of it as the “fuel” for markets. When liquidity is high (more money available), asset prices, including Bitcoin, tend to rise. MartyParty’s theory is that Bitcoin acts like a barometer for this liquidity, with the 12-week lag showing how changes in money supply eventually impact BTC’s value.
This idea isn’t new—some analysts, like those at Lyn Alden, have noted that Bitcoin moves in the same direction as global liquidity about 83% of the time over a 12-month period. Pretty impressive, right?
Why the $140K Prediction?
So, how does MartyParty arrive at $140K? The chart suggests that after a 50% pullback (which we’ve apparently just experienced), Bitcoin is poised for another markup phase. If the liquidity correlation continues, the upward momentum could push BTC past its previous highs. Of course, this is speculative—crypto markets are wild and influenced by everything from regulatory news to market sentiment. But the chart’s visual alignment gives the prediction some weight.
What the Community Thinks
The X thread shows a mix of excitement and skepticism. Some users, like Bernie, throw in a bit of humor, blaming “globalist evil scum” for shorting Bitcoin due to political factors (likely a nod to Trump-related chatter). Others, like HYPEconomist, ask a smart question: what if the correlation breaks? It’s a valid point—past patterns don’t guarantee future results, especially in a market as volatile as crypto.
MartyParty also engages with followers, suggesting a daily timeframe for analysis and noting that global liquidity trends form a “square chart” pattern—meaning they’re steady and predictable over time.
Should You Jump In?
Before you rush to buy Bitcoin, let’s pump the brakes. This prediction is based on technical analysis and historical correlation, not a crystal ball. Factors like macroeconomic shifts, adoption rates, or even a meme coin craze (hey, we cover those at Meme Insider!) could throw things off. If you’re intrigued, consider:
- Watching liquidity indicators (like global M2 money supply).
- Setting price alerts around key levels (e.g., $100K or $120K).
- Doing your own research—DYOR is the crypto motto for a reason!
Final Thoughts
MartyParty’s $140K Bitcoin prediction for 2025 is a thrilling possibility, especially with the global liquidity correlation backing it up. Whether you’re a seasoned trader or just dipping your toes into crypto, this chart offers a fun glimpse into how market analysts think. Keep an eye on X for more updates from MartyParty and the community—crypto moves fast, and the conversation is heating up!
What do you think? Will Bitcoin hit $140K, or is this just another wild ride? Drop your thoughts in the comments, and let’s chat about it!