Hey there, crypto enthusiasts! If you’ve been keeping an eye on the blockchain world, you’ve probably noticed how Bitcoin’s price seems to dance to the tune of global financial moves. A recent tweet from MartyParty caught our attention, sharing a fascinating chart that pits Bitcoin against three versions of global liquidity. Let’s break it down and see what it means for your next crypto move!
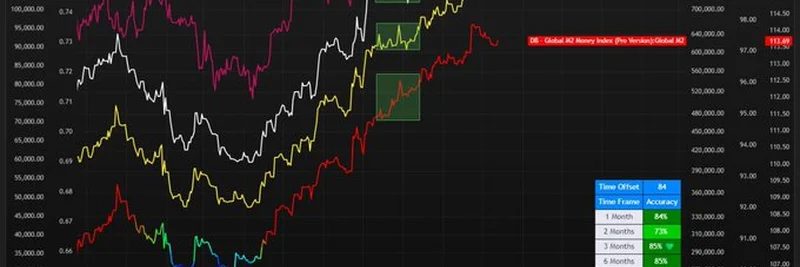
What’s in the Chart?
The image shared by MartyParty, created with TradingView, overlays Bitcoin’s price (in USD) with different global liquidity indices. These indices track the money supply from major central banks worldwide, giving us a peek into how much cash is sloshing around the global economy. Here’s the cool part: the chart highlights a potential correlation between Bitcoin’s ups and downs and these liquidity measures.
You’ll see multiple colored lines—each representing a different liquidity index—dancing alongside Bitcoin’s price. The green boxes zoom in on key moments where these lines seem to align, suggesting that when global liquidity rises, Bitcoin might follow suit. It’s like watching a financial tango!
Why Does Liquidity Matter?
Okay, let’s simplify this. Global liquidity is basically the amount of money available in the world’s financial system. When central banks pump more money into the economy (think stimulus packages or lower interest rates), it’s like adding fuel to the fire. Investors often look for “risk assets” like Bitcoin to park that extra cash, driving up its price. The chart seems to hint that this relationship has been pretty consistent, especially in 2025 so far.
What the Community Says
The tweet sparked some interesting replies. Kadir Uludağ asked a sharp question: “What’s the point of liquidity if it’s not flowing anywhere?” It’s a great point—liquidity only boosts Bitcoin if people are actually spending or investing it. Meanwhile, MyAPTID.bnb shifted gears, hyping up a stock blogger, which shows how these discussions can branch into broader investment chats. It’s a lively mix of skepticism and excitement!
What This Means for Meme Token Fans
At Meme Insider, we’re all about keeping you in the loop on meme tokens and blockchain trends. While this chart focuses on Bitcoin, the insights could spill over into the meme token world. If global liquidity keeps climbing, it might create a bullish environment for riskier assets, including those quirky tokens you love. Keep an eye on these macro trends—they could signal the next big pump!
Final Thoughts
This Bitcoin vs global liquidity chart is a goldmine for anyone trying to time the market. The alignment of liquidity spikes with Bitcoin’s price surges suggests that keeping tabs on central bank moves could give you an edge. Of course, crypto is wild and unpredictable, so don’t bet the farm on charts alone. Pair this with your own research and maybe a sprinkle of meme token hype from our knowledge base!
What do you think—does this chart change how you view Bitcoin’s future? Drop your thoughts in the comments, and let’s chat about it!


