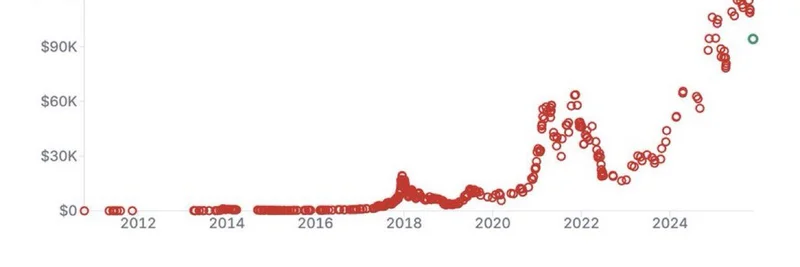
If you've been keeping an eye on Bitcoin's price action lately, you might have noticed some intriguing shifts in whale behavior. Whales, those big holders with massive amounts of BTC, have been a hot topic in crypto circles. A recent post from MartyParty on X highlights a notable change: Bitcoin whale distribution has started to slow down for the first time since August. This comes after what looks like the most aggressive distribution phase right at the start of October, coinciding with Bitcoin's all-time high.
For those new to the term, "distribution" in this context refers to whales selling off their holdings, often to retail investors or smaller players, which can put downward pressure on prices. On the flip side, "accumulation" is when they're buying up more BTC, which can signal confidence and potential upward momentum. The data comes from Glassnode, a leading on-chain analytics platform that tracks blockchain activity to provide insights into investor behavior.
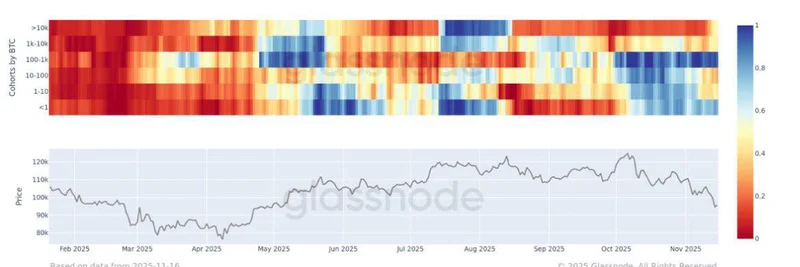
Looking at the chart shared in the post, it's the Trend Accumulation Score by Cohort. This metric breaks down accumulation and distribution trends across different holder groups based on the size of their wallets—from small fish (under 1 BTC) to massive whales (over 10k BTC). The heatmap at the top shows intensity: red for heavy distribution, blue for accumulation. You can see a clear slowdown in red-hot selling among larger cohorts starting recently.
Below the heatmap, there's a line graph tracking Bitcoin's price alongside the overall accumulation score. Notice how the score dipped into distribution territory (below 0.5) around the price peak in October, but now it's showing signs of stabilization. This could mean whales are holding off on further dumps, perhaps waiting for the next big move or even starting to accumulate quietly.
Why does this matter for meme token enthusiasts and blockchain practitioners? Well, Bitcoin's market trends often ripple into the altcoin and meme coin space. If whales are easing up on selling BTC, it might free up capital for riskier plays like meme tokens, which thrive on hype and liquidity. We've seen in past cycles how BTC stabilization leads to altseason booms—think Dogecoin or Shiba Inu runs.
Of course, this is just one data point. On-chain metrics like this should be viewed alongside other indicators, such as trading volume, sentiment on platforms like X, or even macroeconomic factors. For deeper dives, check out Glassnode's dashboard for real-time updates.
If you're building in blockchain or trading meme tokens, keeping tabs on these whale moves can give you an edge. It helps anticipate shifts in liquidity that could impact your favorite projects. What's your take—bullish signal or just a pause before more distribution? Drop your thoughts in the comments below.
Stay tuned to Meme Insider for more breakdowns on crypto trends that matter.