Hey there, crypto enthusiasts! If you’ve been keeping an eye on Bitcoin lately, you’re in for a treat. MartyParty, a well-known voice in the crypto community, dropped an exciting update on X about Bitcoin’s price action. The post, shared on July 2, 2025, dives into a detailed chart analysis using the Wyckoff Method, hinting at a potential breakout with a target of $146,800. Let’s break it down and see what this means for the market!
The Wyckoff Accumulation Phase Explained
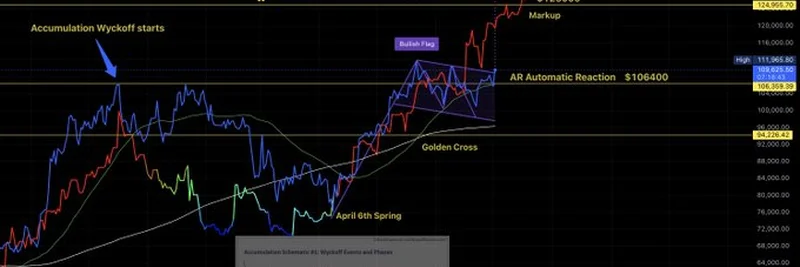
First off, let’s talk about the Wyckoff Method. It’s a technical analysis approach that helps traders predict price movements based on supply and demand dynamics. MartyParty’s chart highlights Bitcoin’s accumulation phase, which started back in February 2025 and ran through July 2nd. This phase is all about big players (think institutions) quietly building their positions before a big move. The chart marks this period with a blue arrow labeled “Accumulation Wyckoff starts,” setting the stage for what’s next.
Key Chart Patterns to Watch
The chart is packed with interesting patterns. One standout is the bullish flag, a continuation pattern that signals a pause in an upward trend before another leg up. MartyParty notes that Bitcoin has broken out of this flag, aligning with an automatic reaction at $106,400. This breakout is a big deal—it suggests the bulls are back in control.
Another exciting signal is the golden cross, where a short-term moving average (like the 50-day) crosses above a long-term one (like the 200-day). This is often seen as a bullish sign, and it’s marked clearly on the chart around April. Combined with the April 6th “spring” (a fakeout drop that traps sellers), it’s a recipe for optimism.
The Target: $146,800
So, what’s the endgame? MartyParty points to a target of $146,800, labeled as the “Target” on the chart. This comes after a “markup” phase, where prices are expected to rise sharply. The chart also shows a current high of $119,658, meaning there’s still room to grow if this prediction holds. The inset diagram of Wyckoff’s accumulation phases (A through E) gives us a roadmap, with Bitcoin seemingly moving into the markup stage.
What This Means for Crypto Traders
This analysis is a goldmine for anyone trading Bitcoin. The breakout from the bullish flag and the golden cross are green lights for bullish momentum. However, it’s smart to keep an eye on confirmation points—like sustained volume on the breakout—and invalidation levels, such as a drop below the flag’s lower trendline. If you’re new to this, tools like TradingView can help you track these patterns in real-time.
Meme Insider Take
At Meme Insider, we love digging into the latest crypto trends, even beyond meme tokens. This Bitcoin analysis shows how traditional technical methods can apply to the wild world of cryptocurrencies. Whether you’re a blockchain practitioner or just curious, understanding these patterns can sharpen your market skills. Plus, with Bitcoin potentially hitting $146,800, it could spill over into meme token hype—something we’ll keep you posted on!
Final Thoughts
MartyParty’s update is a thrilling peek into Bitcoin’s future, backed by solid chart work. As of 12:41 AM +07 on July 3, 2025, the crypto community is buzzing about this potential breakout. Will Bitcoin hit $146,800? Only time will tell, but this analysis gives us plenty to chew on. Drop your thoughts in the comments, and let’s discuss how this might impact the broader market!


