If you're deep into the world of meme tokens, you know that Bitcoin's movements often dictate the mood of the entire crypto ecosystem. A recent tweet from crypto commentator MartyParty has sparked discussions among traders, highlighting a key technical level in BTC's price chart. Let's break it down and see what it could mean for your favorite meme coins.
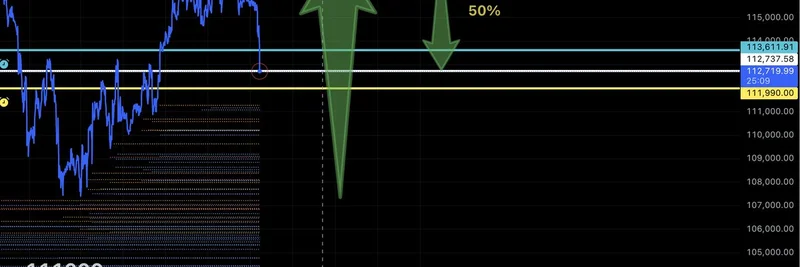
MartyParty, known for his sharp macro analysis and crypto insights, posted a chart showing Bitcoin's price action with a focus on a 50% retracement level. Specifically, he pointed out that the 112,600 line stems from the 50% retrace of the one-hour move from September 1 to the peak on September 19. This kind of Fibonacci retracement is a popular tool among traders to identify potential support or resistance levels during pullbacks.
Looking at the chart, you can see Bitcoin's price dipping sharply, marked by a green downward arrow labeled "50%," right around that 112,600 mark. This suggests a classic correction phase after a strong upward move. For context, Fibonacci retracements are based on the idea that markets often retrace a predictable portion of a move before continuing in the original direction. The 50% level isn't a strict Fibonacci ratio but is commonly watched as a psychological midpoint.
Now, why should meme token enthusiasts care? Meme coins like Dogecoin, Shiba Inu, or newer entrants often amplify Bitcoin's volatility. When BTC pulls back, altcoins—and especially memes—tend to feel the pain more intensely due to their speculative nature. If this 50% retrace holds as support, it could signal a bounce, potentially reigniting risk appetite and sending meme tokens surging. On the flip side, a break below could lead to further downside, pressuring liquidity in the meme space.
Traders in the replies echoed this sentiment. One user asked about spotting these levels for stablecoin rotations, hinting at strategies to preserve capital during dips. Another optimistically noted the alignment with retracement principles, while a bearish voice warned of deeper declines. It's a reminder that in crypto, technical analysis like this can guide decisions, but it's always paired with market sentiment.
For blockchain practitioners building or trading meme tokens, keeping an eye on BTC's key levels is crucial. Tools like Fibonacci can help anticipate shifts, allowing you to position accordingly. If you're new to this, start by checking out resources on TradingView for charting practice or dive into crypto communities on platforms like X for real-time insights.
As the market evolves, analyses like MartyParty's provide valuable breadcrumbs. Whether this retrace marks the bottom or just a pause, it underscores the interconnectedness of Bitcoin and meme tokens. Stay vigilant, and remember: in the wild world of memes, timing can make all the difference.

