In the ever-evolving world of cryptocurrency, keeping an eye on macro indicators can make all the difference. Recently, crypto analyst Marty Party shared a compelling chart on X that highlights how Bitcoin's high timeframe movements are closely tracking global liquidity. If you're into meme tokens or broader blockchain tech, understanding these patterns could help you navigate the volatile markets better. Let's break it down step by step.
Understanding the Chart: Bitcoin and Global Liquidity
Global liquidity refers to the total amount of money available in the global financial system, often influenced by central banks' policies like quantitative easing or tightening. When liquidity increases, it tends to fuel asset prices, including cryptocurrencies like Bitcoin.
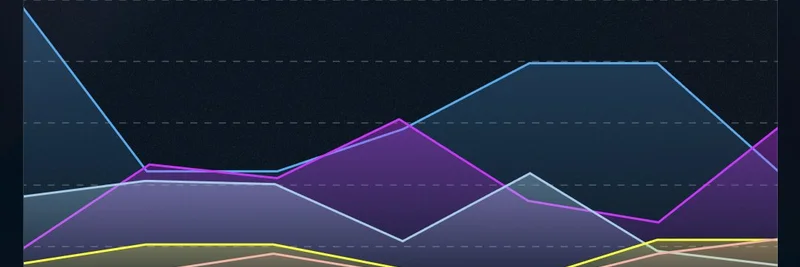
Marty Party's chart overlays Bitcoin's price action with a global liquidity index, showing a strong correlation. Starting from January 2024, when a monetary policy shift began, we see Bitcoin entering various phases of the Wyckoff reaccumulation model—a technical analysis framework developed by Richard Wyckoff in the early 20th century. This model helps identify accumulation (buying) and distribution (selling) phases in markets.
As seen in the image above, key annotations include:
- Wyckoff Reaccumulation Jan/Nov 2024: This period shows Bitcoin consolidating after a downtrend, where smart money (large investors) accumulates positions at lower prices.
- April 6th Spring: A classic Wyckoff term for a brief price drop below support to shake out weak hands before an uptrend.
- Wyckoff Accumulation Feb/July: Further building of positions during sideways movement.
- AR Automatic Reaction: A quick price rebound after the spring, confirming bullish momentum.
- Markup: The phase where prices start rising significantly as demand overtakes supply.
- Wyckoff ReAccumulation Aug/Dec: Projected ongoing accumulation leading into year-end.
- Jan 2026: A potential milestone for further upside.
The chart suggests that since the policy shift in early 2024, Bitcoin has been in a bullish trajectory, with projections extending into 2026. The global liquidity line is trending upward, crossing thresholds like $106,400 and aiming for $165,000, which could propel BTC to new highs.
Why This Matters for Meme Tokens and Blockchain Enthusiasts
While Bitcoin isn't a meme token per se, its performance often sets the tone for the entire crypto ecosystem. Meme coins like Dogecoin or newer entrants thrive in high-liquidity environments where risk appetite is strong. If global liquidity continues to expand—as hinted by the chart— we might see a surge in altcoin and meme token activity.
Marty Party, known for his macro analysis and crypto commentary, emphasizes that this isn't financial advice but educational insight. His original tweet has sparked discussions, with replies debating cycle lengths and potential pullbacks.
Key Takeaways and SEO Tips for Traders
- Monitor Macro Shifts: Keep tabs on central bank announcements, as they directly impact liquidity.
- Learn Wyckoff Basics: For beginners, the Wyckoff method simplifies spotting market manipulations and true trends. Resources like Investopedia's Wyckoff guide can be a great start.
- Diversify with Knowledge: At Meme Insider, we believe in building a robust knowledge base. Whether you're holding BTC or chasing meme pumps, understanding these correlations enhances your strategy.
This analysis aligns with broader trends in blockchain technology, where liquidity drives innovation and adoption. Stay tuned for more updates on how macro factors influence your favorite meme tokens!