Hey there, fellow crypto enthusiasts! If you're knee-deep in the world of blockchain and meme tokens, you know that Bitcoin's movements often set the stage for the entire market. Recently, on August 13, 2025, crypto commentator and macro analyst MartyParty (@martypartymusic) dropped a bombshell tweet that's got everyone buzzing. He shared a detailed chart showing how Bitcoin's high timeframe price action is closely following global liquidity trends, predicting we're headed much higher than the current all-time highs. Let's break this down in simple terms and see what it means for your favorite meme coins.
Understanding the Chart: Bitcoin and Global Liquidity
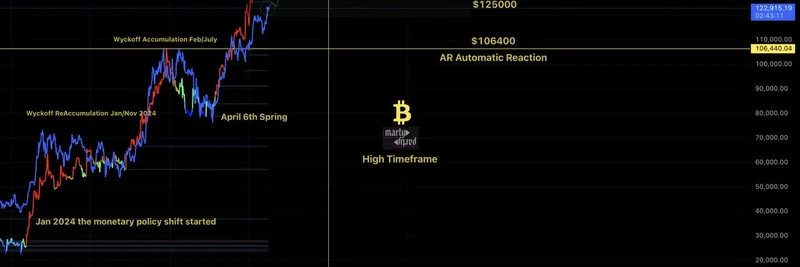
At first glance, the chart might look like a colorful spaghetti of lines, but it's packed with insights. The main focus is Bitcoin's price (in USD) plotted against time, overlaid with global liquidity levels. Global liquidity refers to the total amount of money flowing through the world's financial systems—think central banks printing money or easing policies that make cash more available.
MartyParty highlights a key shift: In January 2024, there was a monetary policy change that kickstarted this bull run. From there, the chart identifies several phases using the Wyckoff Method, a classic technical analysis tool named after Richard Wyckoff. This method helps spot when big players (like institutions) are accumulating assets before a big markup in price.
Here's a quick rundown of the phases marked on the chart:
- Wyckoff Reaccumulation (Jan/Nov 2024): This is where smart money starts buying up Bitcoin quietly after a dip, building a base for the next uptrend.
- April 6th Spring: A test of support levels, shaking out weak hands before the real climb begins.
- Wyckoff Accumulation (Feb/July): More building up, with price consolidating in a range.
- AR Automatic Reaction: A quick pullback or reaction point, often seen as a buying opportunity.
- Wyckoff Reaccumulation (Aug/Dec): Another round of accumulation, setting up for the big move.
- Markup: The exciting part—the upward surge where prices really take off.
The projection? Bitcoin could hit around $165,000 by January 2026, with interim targets like $140,000 by Aug/Dec 2025 and $125,000 along the way. And get this: Even though Bitcoin hit an all-time high on August 14, 2025 (as per the tweet's timing), global liquidity trends suggest we're not done yet. The chart shows liquidity climbing steadily, which historically correlates with Bitcoin's pumps.
Why Global Liquidity Matters for Crypto
In layman's terms, when there's more money sloshing around the global economy—due to things like interest rate cuts or quantitative easing—investors have more capital to pour into risk assets like Bitcoin. This isn't just theory; past cycles show Bitcoin thriving in high-liquidity environments. For instance, the 2021 bull run coincided with massive stimulus packages during the pandemic.
MartyParty's analysis ties this macro view to Bitcoin's chart, arguing that as long as liquidity keeps rising, so will BTC. It's a reminder that crypto isn't isolated—it's intertwined with broader economic forces.
Implications for Meme Tokens: Ride the Bitcoin Wave
Now, why should meme token holders care? Simple: Meme coins like Dogecoin, Shiba Inu, or the latest viral sensations often amplify Bitcoin's moves. When BTC surges, altcoins and memes follow suit, sometimes with 10x or more gains due to their speculative nature. If MartyParty's prediction holds and Bitcoin blasts past $100K toward $165K, expect a frenzy in the meme space.
Think about it—higher Bitcoin prices mean more liquidity trickling down to smaller caps. Projects with strong communities and clever marketing could see explosive growth. But remember, this is all based on technical and macro analysis; always do your own research and consider the risks, as markets can be unpredictable.
If you're looking to dive deeper into Wyckoff patterns, check out resources like Investopedia's guide on the Wyckoff Method. And for real-time updates, follow MartyParty on X for more charts and commentary.
What do you think— is Bitcoin gearing up for another leg up? Drop your thoughts in the comments below, and stay tuned to Meme Insider for more breakdowns on how big-picture trends affect your meme portfolio!