In a recent tweet that's catching the eye of crypto enthusiasts, macro analyst MartyParty highlighted a fascinating indicator that could signal the start of the next big bull run in cryptocurrencies. The post, shared on X (formerly Twitter), points to the Copper-to-Gold ratio as a telltale sign for smart money investors that the business cycle is bottoming out, often preceding parabolic surges in crypto prices. You can check out the original tweet here.
Understanding the Copper-to-Gold Ratio
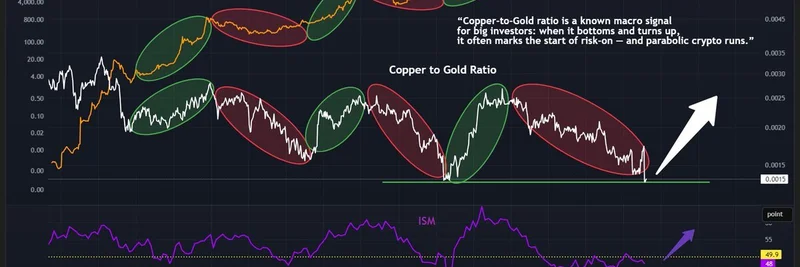
The Copper-to-Gold ratio is a simple yet powerful macroeconomic tool used by investors to gauge the health of the global economy. Copper, often called "Dr. Copper" for its ability to predict economic trends, is widely used in manufacturing and construction. Gold, on the other hand, is a safe-haven asset that shines during times of uncertainty.
When the ratio (copper price divided by gold price) bottoms out and starts rising, it typically indicates improving economic conditions—think increased industrial demand driving up copper prices relative to gold. This shift often marks a "risk-on" environment where investors pour money into higher-risk assets like stocks and cryptocurrencies.
Link to the Business Cycle and ISM Index
MartyParty's chart cleverly overlays the Copper-to-Gold ratio with the ISM Manufacturing Index, a monthly survey that measures U.S. manufacturing activity. Levels above 50 indicate expansion, while below signal contraction. As the chart shows, the ratio's upturns have historically aligned with ISM bottoms, foreshadowing economic recoveries.
For crypto traders, this is huge. Parabolic runs—those steep, exponential price increases we've seen in Bitcoin and altcoins—tend to happen in these risk-on phases. The tweet credits @alfoad_gabriel for the insight, emphasizing how this pattern has played out before major crypto booms.
Historical Correlations with Crypto Bull Markets
Looking back, similar setups have preceded iconic crypto rallies. For instance, during the 2017 bull run that saw Bitcoin skyrocket to nearly $20,000, macro indicators like this were flashing green. Fast forward to 2021, and we witnessed another explosive cycle fueled by post-pandemic stimulus and risk appetite.
Meme tokens, in particular, thrive in these environments. Coins like Dogecoin and Shiba Inu exploded during the last bull market, riding waves of retail frenzy and liquidity. If the Copper-to-Gold ratio is indeed signaling a turnaround, meme token holders could be in for a wild ride as capital flows back into speculative assets.
What This Means for Meme Tokens Today
In today's market, with Bitcoin hovering around key levels and altcoins showing signs of life, this macro signal couldn't come at a better time. Meme tokens, known for their viral potential and community-driven hype, often amplify broader crypto trends. A parabolic run could mean massive gains for projects with strong narratives and liquidity.
Of course, nothing's guaranteed in crypto. Always do your own research and consider factors like regulatory news or global events. But for those tracking macro cues, this ratio is one to watch closely.
As blockchain practitioners, keeping an eye on these traditional indicators can give you an edge in navigating the volatile world of meme tokens and beyond. Stay tuned to Meme Insider for more insights on how macro trends intersect with the crypto space.