If you've been keeping an eye on the crypto world, you know that meme tokens and major cryptocurrencies don't exist in a vacuum. They're often influenced by broader market trends, including what's happening in traditional stocks. A recent tweet from MartyParty (@martypartymusic on X) perfectly illustrates this point, showcasing charts from August 5th that highlight the eerie synchronization between US stock markets and crypto futures.
MartyParty, a crypto commentator and macro analyst, posted a side-by-side comparison of several key assets. The visuals capture a snapshot of that day's trading action, revealing how everything from stock indices to top cryptos moved in lockstep during a notable dip. For those new to trading lingo, let's break it down simply: futures are contracts to buy or sell an asset at a future date, often used to speculate on price movements without owning the underlying asset.
Breaking Down the Charts
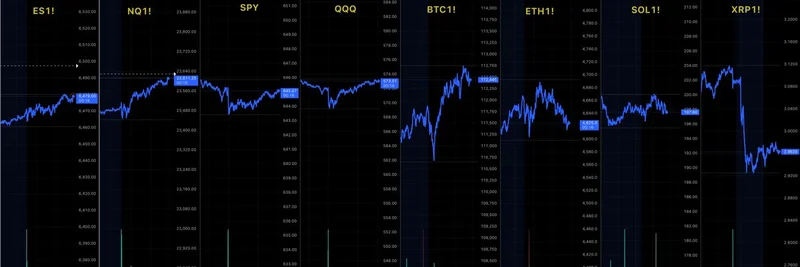
Looking at the image, you'll see eight charts lined up, each representing a different ticker:
- ES1!: This is the E-mini S&P 500 futures contract, tracking the broad US stock market.
- NQ1!: Nasdaq-100 futures, focusing on tech-heavy stocks.
- SPY: The SPDR S&P 500 ETF, a popular way to invest in the S&P 500 index.
- QQQ: Invesco QQQ Trust, mirroring the Nasdaq-100.
- BTC1!: Bitcoin futures, giving a glimpse into the king of crypto's price action.
- ETH1!: Ethereum futures, the backbone of many DeFi and NFT projects.
- SOL1!: Solana futures, known for its speed and often tied to meme token ecosystems.
- XRP1!: XRP futures, associated with Ripple's cross-border payment solutions.
Each chart shows intraday price movements with candlesticks (those blue lines) and volume bars at the bottom in teal and red. Notice the similar patterns: a period of choppy trading followed by a sharp drop, with volume spiking during the decline. This suggests a risk-off event where investors were selling across the board, treating crypto much like high-beta stocks—assets that amplify market moves.
On August 5th, global markets faced turbulence, possibly due to macroeconomic factors like interest rate concerns or geopolitical tensions. While the exact triggers can vary, the key takeaway is the correlation. When stocks sneeze, crypto often catches a cold, and meme tokens? They might end up with the flu, given their higher volatility.
Why This Matters for Meme Token Traders
At Meme Insider, we're all about helping you navigate the wild world of meme tokens—those community-driven coins that can skyrocket on hype or plummet on sentiment shifts. But as this tweet demonstrates, meme tokens don't operate independently. Many are built on chains like Solana or Ethereum, so when ETH or SOL dips sharply (as seen in the charts), meme projects often follow suit, sometimes even more dramatically.
For instance, if you're holding positions in popular memes like Dogecoin or newer ones on Solana, understanding these correlations can help you anticipate moves. Tools like TradingView—where these charts likely originated—allow you to overlay assets and spot patterns early. It's a reminder that diversifying beyond crypto or using hedging strategies with futures could be smart plays.
MartyParty's post sparked some reactions, with users noting Bitcoin's resilience amid the dip and others appreciating the shift away from politics to pure market analysis. It's posts like these that cut through the noise and provide real value.
Key Insights and Takeaways
- Market Interconnectivity: Crypto is increasingly intertwined with traditional finance. Events in stocks can ripple into meme token prices quickly.
- Volume Tells a Story: Those spikes in the charts indicate heightened trading activity, often signaling panic selling or buying opportunities.
- Stay Informed: Follow analysts like MartyParty for visual breakdowns that make complex data digestible. And check out resources on CoinMarketCap for real-time futures data.
Whether you're a seasoned trader or just dipping your toes into meme tokens, keeping an eye on these broader trends can give you an edge. What do you think—will we see more decoupling between crypto and stocks in the future, or is this the new normal? Drop your thoughts in the comments below, and stay tuned to Meme Insider for more breakdowns like this.