In the fast-paced world of cryptocurrency trading, understanding liquidation levels can make all the difference between riding a wave and getting wiped out. If you're into meme tokens, which are notoriously volatile, keeping an eye on these metrics for major coins can provide crucial context for the broader market. Recently, on August 13th, crypto commentator MartyParty shared a compelling chart on X (formerly Twitter) that breaks down liquidation levels for several key assets, including Bitcoin (BTC), Solana (SOL), Sui (SUI), Ethereum (ETH), XRP, Hyperliquid's HYPE, and Binance Coin (BNB). Let's dive into what this means and why it matters.
What Are Liquidation Levels in Crypto?
For those new to the scene, liquidation levels refer to price points where leveraged positions in futures or perpetual contracts get automatically closed out by exchanges to prevent further losses. This happens when the market moves against a trader's position, and their collateral (margin) isn't enough to cover the losses. In a bull market, high liquidation levels above the current price can act as resistance, while those below can serve as support or targets for dips.
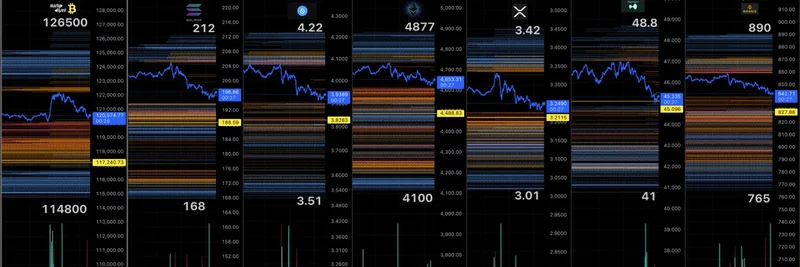
MartyParty's chart, captured at 11:25 AM on August 13th, uses colorful bands to visualize these levels, with yellow lines now indicating 50% pullback points – a new addition noted in the post. This is particularly useful for spotting potential reversal zones or areas where the market might flush out over-leveraged players.
Breaking Down the Chart: Key Insights for Each Coin
Looking at the screenshot, we see side-by-side 30-second timeframe charts for each asset, complete with price action, volume bars at the bottom, and overlaid liquidation bands. Here's a quick rundown:
Bitcoin (BTC): Trading around $12,650, with a notable cluster of liquidations below at around $11,480. The yellow 50% pullback line sits near $12,074, suggesting a potential dip target if selling pressure intensifies.
Solana (SOL): Priced at about $212, showing tighter bands with a pullback line at $196.86. Solana's ecosystem is home to many meme tokens, so fluctuations here often ripple through to projects like Dogwifhat or Bonk.
Sui (SUI): At $4.22, this layer-1 blockchain's token has liquidation levels stacked below $3.51, indicating possible downside if the market turns bearish.
Ethereum (ETH): Hovering near $4,887, with the yellow line at $4,688. As the backbone for countless ERC-20 meme tokens, ETH's stability is key for the meme coin frenzy.
XRP: Around $3.42, with pullbacks marked at $3.24. While not directly tied to memes, XRP's movements can influence overall market sentiment.
HYPE (Hyperliquid): Trading at $48.8, this token from the Hyperliquid DEX – known for perp trading of various assets, including memes – has a pullback at $46.35. Given Hyperliquid's focus on high-speed trading, HYPE's levels are worth watching for anyone dabbling in leveraged meme plays.
Binance Coin (BNB): At $890, with the 50% line at $842.71. BNB powers the Binance ecosystem, which hosts plenty of meme token launches on its Smart Chain.
These levels aren't set in stone – they're dynamic and update with market conditions. But charts like this from MartyParty on X give traders a snapshot to inform their strategies.
Why This Matters for Meme Token Enthusiasts
Meme tokens thrive on hype and volatility, often amplified by movements in major coins. A liquidation cascade in BTC or ETH can trigger chain reactions, dumping meme prices or creating buy-the-dip opportunities. For instance, if SOL dips to its pullback level, meme projects built on Solana might see exaggerated swings. Tools like MartyParty's chart help you anticipate these events, especially if you're trading perps on platforms like Hyperliquid, where HYPE plays a central role.
MartyParty also linked to a live Twitter Space (listen here) for deeper discussion – a great resource for real-time insights.
Tips for Navigating Liquidations in Meme Trading
To stay ahead:
Monitor Major Coins: Use liquidation data from sources like Coinglass or Hyblock Capital to correlate with meme token charts.
Manage Leverage Wisely: High leverage can lead to quick liquidations; stick to spot trading for memes if you're risk-averse.
Diversify: Don't put all your eggs in one meme basket – balance with stables or blue-chips like those in the chart.
Stay Informed: Follow analysts like MartyParty for updates, and join communities on X or Discord for meme-specific alerts.
In summary, MartyParty's latest chart is a goldmine for understanding where the crypto market might head next. Whether you're HODLing HYPE or chasing the next big meme, keeping tabs on these liquidation levels can sharpen your edge in this wild ride of a market. What are your thoughts on these pullbacks? Drop a comment below!


