In the fast-paced world of cryptocurrency trading, understanding liquidation levels is crucial for navigating market volatility. These are essentially price thresholds where leveraged positions are forcibly closed to cover losses, often triggering chain reactions in price movements. For meme token enthusiasts and blockchain practitioners, keeping tabs on these levels can help anticipate swings in popular assets and even spot opportunities in emerging tokens.
Crypto commentator and macro analyst MartyParty, known for his insightful takes on the market, recently dropped an update on X (formerly Twitter) about liquidation levels as of noon on September 8, 2025. Check out the original post here. Accompanying the tweet is a detailed chart visualizing these levels across several key cryptocurrencies, along with links to a live Twitter Space and a YouTube video for deeper dives.
Breaking Down the Chart
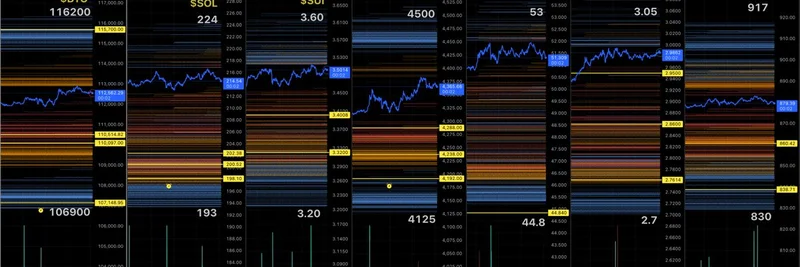
The chart features 30-second timeframe views for assets like Bitcoin (BTC), Solana (SOL), Sui (SUI), Ethereum (ETH), Hyperliquid (HYPE), XRP, and Binance Coin (BNB). Each panel shows price action with overlaid heatmaps—those colorful horizontal bands representing clusters of potential liquidations. The yellow lines highlight significant levels where large volumes of positions could get wiped out if prices hit them.
Here's a quick rundown of the notable levels from the visualization:
- Bitcoin (BTC): Trading around $51,620, with major downside liquidations clustered at $51,000, $50,748, and lower at $50,690. Upside levels include $51,100 and $51,300.
- Solana (SOL): At approximately $224, key supports at $220, $215.54, and $202.38, with resistance near $228.
- Sui (SUI): Hovering at $3.60, watch for liquidations at $3.50, $3.32, and $3.20.
- Ethereum (ETH): Around $4,500, with clusters at $4,500, $4,425, and $4,175.
- Hyperliquid (HYPE): An interesting one for meme token watchers—priced at $53, with potential wipes at $50, $48, and $44.80. HYPE, the native token of the Hyperliquid decentralized exchange, has been gaining traction in DeFi circles and could see meme-like volatility.
- XRP: At $3.005, levels at $2.98, $2.80, and $2.70.
- Binance Coin (BNB): Trading near $917, with supports at $900, $860.42, and $830.
Below the price charts, you'll notice volume bars in teal and red, indicating buying and selling pressure over the recent sessions.
Why This Matters for Meme Tokens
While not all these assets are pure meme coins, the inclusion of HYPE highlights how liquidation data can apply to newer, more speculative tokens. Meme tokens often ride waves of hype and community-driven momentum, making them particularly susceptible to liquidation cascades. For instance, if a major player like BTC dips and triggers widespread liquidations, it could ripple into meme markets on platforms like Solana, where many viral tokens launch.
MartyParty also linked to a Twitter Space broadcast and a YouTube video titled '30s Liquidation Levels for crypto traders', which likely expand on these charts with real-time analysis. If you're into technical trading, these resources are gold for refining your strategies.
Tips for Traders
To stay ahead:
- Use tools like TradingView (as seen in the chart) to monitor these levels yourself.
- Consider the broader market context—economic news or regulatory updates can amplify liquidations.
- For meme tokens specifically, pair this data with social sentiment from X or Discord communities.
Remember, this is for educational purposes only, not financial advice. The crypto space moves quickly, so always do your own research.
Stay tuned to Meme Insider for more updates on meme tokens, blockchain tech, and market insights that help you level up your game.

