If you're navigating the fast-paced world of crypto trading, especially with meme tokens and major blockchain assets, keeping an eye on liquidation levels can be a game-changer. Recently, MartyParty, a well-known crypto commentator and analyst on X, dropped a timely update on 30-second timeframe liquidation levels for several popular tokens. This includes the emerging HYPE token from Hyperliquid, alongside heavyweights like BTC, SOL, SUI, ETH, XRP, and BNB. Let's break it down in a way that's easy to grasp, even if you're new to the scene.
MartyParty shared this snapshot on September 20, 2025, at around 12:42 PM, complete with a quick video explanation. You can check out the original post here and watch the 30-second rundown on YouTube. He also linked to a live broadcast on X for more context.
What Are Liquidation Levels in Crypto Trading?
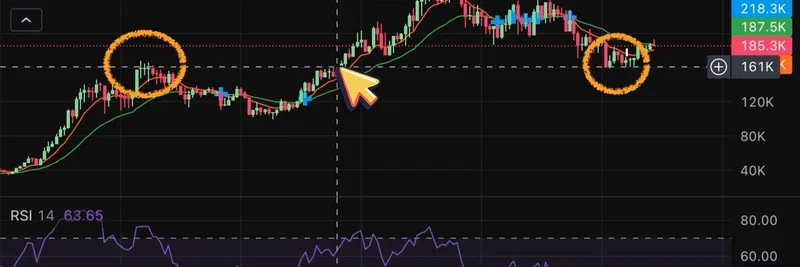
First things first: liquidation levels are critical price points in leveraged trading where positions get automatically closed if the market moves against them. This happens to prevent further losses beyond the trader's margin. On platforms like Binance, these levels are visualized with colored lines—blue for low leverage (25-50x), yellow for medium (50-100x), and red for high (100x+). When prices hit these lines, liquidations trigger, often leading to rapid price swings due to cascading effects.
MartyParty emphasizes ditching traditional technical analysis (TA) in favor of following liquidity flows. He shared a handy guide earlier this year on how to trade these levels effectively. In it, he outlines setups for longs and shorts based on where these lines converge or end:
- Short Setup A (Low Risk): Where the top blue lines end.
- Short Setup B (Mid Risk): Upper yellow meets upper blue.
- Short Setup C (High Risk): Upper red meets upper yellow.
- Long Setup C (High Risk): Lower red meets lower yellow.
- Long Setup B (Mid Risk): Lower yellow meets lower blue.
- Long Setup A (Low Risk): Where the lower blue lines end.
His advice? Stick to Setup A for safety, always use stop losses, and manage risks wisely. This isn't financial advice—just educational insights. You can view the full guide here, which includes a visual example on a BTC chart.
Breaking Down the Charts: Key Levels for Each Token
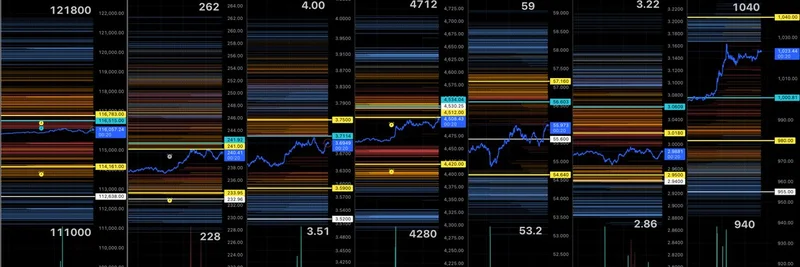
The shared image features 30-second charts from TradingView, highlighting current prices and potential liquidation zones. Here's a quick rundown of the notable levels for each token as of the snapshot. Remember, these are ultra-short-term and can shift quickly—always verify with real-time data.
BTC (Bitcoin)
Current price around $12,180. Marked liquidation clusters include upper levels at $11,678 and $11,667, with lower supports at $11,461, $11,362, and down to $11,100. The chart shows a mix of blue, yellow, and red lines, suggesting potential volatility if prices dip below $11,500.
SOL (Solana)
Trading near $262. Key upper resistances at $266 and $264, with liquidations clustering around $243-$240 on the downside. This could indicate a short setup if it breaks lower blues.
SUI
At approximately $4.00. Upper yellows around $3.714 and $3.643, lowers at $3.51 and $3.300. Watch for cascades if it hits the red zones.
ETH (Ethereum)
Hovering at $4,712. Significant levels include $4,834 upper, $4,683, and lowers like $4,420 and $4,200. Given ETH's role in many meme token ecosystems, these could influence broader market moves.
HYPE (Hyperliquid)
The star for meme enthusiasts—HYPE is at $59. Upper resistances at $56.603 and $55.00, with potential liquidations below at $54.64 and $53.00. As Hyperliquid's native token for its high-speed DEX focused on perps, HYPE's levels are worth monitoring for quick flips in the meme space.
XRP (Ripple)
Around $3.22. Charts show uppers at $3.309 and $3.180, lowers at $2.960, $2.900, and $2.860. XRP's stability makes these levels key for cross-chain plays.
BNB (Binance Coin)
At $1,040. Upper clusters at $1,034 and $1,001, with supports at $989 and $950. As Binance's token, it ties directly into the leverage data MartyParty uses.
These levels can act as magnets for price action, pulling towards liquidity pools where liquidations occur. For meme token traders, understanding this for assets like HYPE can help spot opportunities in volatile pumps or dumps.
Why This Matters for Meme Token Enthusiasts
While not all these are pure meme tokens, HYPE has a community-driven vibe with its focus on decentralized perps, fitting right into the meme-insider knowledge base. MartyParty's updates like this one provide actionable insights to stay ahead in blockchain trading. If you're building your strategy, consider how these liquidation dynamics play into broader trends—perhaps even pairing HYPE with SOL-based memes for diversified plays.
For more on trading along with these levels, MartyParty recommends checking out platforms like WEEX via his referral link. As always, trade responsibly and do your own research.
Stay tuned to Meme Insider for more breakdowns on crypto news and meme token strategies! If you've got thoughts on these levels or HYPE's potential, drop them in the comments.