In the fast-paced realm of Solana meme coins, where pumps and dumps happen in the blink of an eye, savvy traders are turning to advanced tools like Dynamic Liquidity Market Makers (DLMM) to stack profits. A recent tweet from technical analyst @tendorian9 breaks down a real-life example using the Valhalla token, showcasing how to time an exit for impressive returns. Valhalla, a meme coin inspired by Norse mythology and built on Solana's high-speed blockchain, provided the perfect backdrop for this strategy.
Understanding the DLMM Setup on Valhalla
DLMM, short for Dynamic Liquidity Market Maker, is a feature offered by Meteora, a decentralized exchange on Solana that allows users to provide liquidity in concentrated ranges. This is similar to concentrated liquidity in Uniswap V3 but with dynamic adjustments for better efficiency. In simple terms, it lets you earn fees from trades while positioning yourself to benefit from price movements.
In this case, @tendorian9 spotted Valhalla pumping to its all-time high (ATH) with strong trading volume. ATH refers to the highest price a token has ever reached. To capitalize on the inevitable dump—when prices drop after a surge—they set up a one-sided DLMM position. This was a wide-range setup at -95% SOL spot position with a bin step of 125 and a base fee of 10%.
Why go wide? A tighter range might yield higher fees in ideal scenarios, but a wider one acts as insurance against a "rug pull," where developers suddenly remove liquidity, crashing the price. By going wide, you reduce the risk of your position getting wiped out if things go south.
Timing the Exit with Technical Indicators
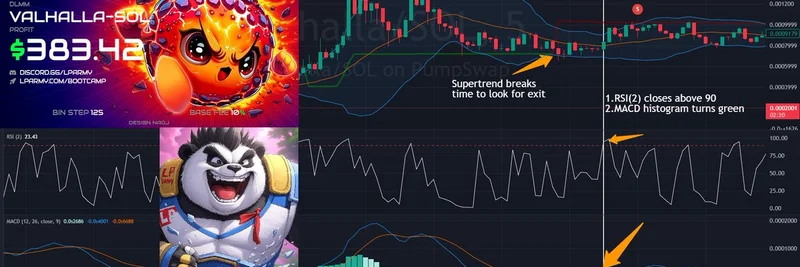
The key to profits here was knowing when to pull out. @tendorian9 was monitoring 5-minute charts while on the go (driving, no less!), aiming for a quick exit rather than holding longer on 15-minute charts.
The first red flag was the break of the Supertrend support line. Supertrend is a popular indicator that combines average true range (ATR) with price trends to signal potential reversals—think of it as a dynamic stop-loss line.
Once that broke, they waited for confirmation from at least two more indicators:
- RSI(2): The Relative Strength Index with a period of 2 measures overbought or oversold conditions on a short timeframe. Here, it closed above 90, signaling extreme overbought territory and a likely pullback.
- MACD: Moving Average Convergence Divergence tracks the relationship between two moving averages. The histogram turning green (or showing the first positive bar after the breakdown) indicated momentum shifting.
These converging signals screamed "exit now." Even though @tendorian9 was a bit late due to being behind the wheel, the price stabilized, allowing an exit with a whopping +383.42% profit, as shown in the chart.
Lessons from the Thread and Community Feedback
The tweet emphasizes finding your own edge— a repeatable strategy—and sticking to it for consistent wins. Tagged were @met_lparmy (Meteora's LP Army community) and @MeteoraAG, highlighting the collaborative vibe in Solana's DeFi space.
Replies added more insights:
- One user praised the wide-range approach for safety, noting that stacking small 1-3% gains compounds over time.
- Another asked about large deposits relative to total value locked (TVL) in pools, to which @tendorian9 replied it's not a big deal—ignore it and focus on your plan.
This example underscores why DLMM is gaining traction among meme coin traders on Solana. Platforms like Meteora make it accessible, but success boils down to discipline and technical know-how.
If you're diving into meme tokens like Valhalla, remember: always do your own research (DYOR), and tools like DEX Screener can help track real-time data. Whether you're a newbie or seasoned trader, strategies like this can level up your game in the volatile world of crypto.


