Hey there, crypto enthusiasts! If you’ve been keeping an eye on the Ethereum market, you’ve probably noticed some exciting chatter on X lately. A post by @martypartymusic has caught the attention of many, showcasing a stunning example of an inverse head and shoulders pattern on Ethereum’s daily chart. Posted on August 10, 2025, at 01:41 UTC (which is 10:41 AM JST, just a couple of hours before now!), this analysis suggests that Ethereum might be gearing up for a bullish move. Let’s break it down and see what this means for the crypto world!
What’s the Inverse Head and Shoulders Pattern?
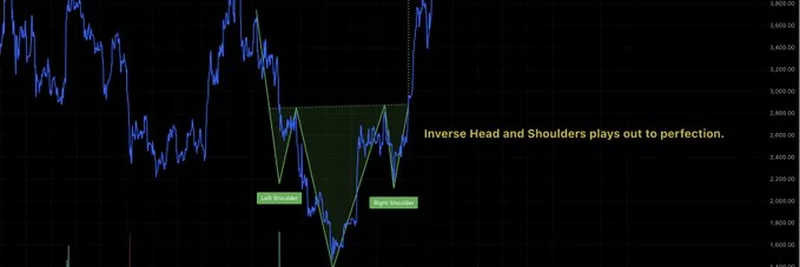
For those new to trading, the inverse head and shoulders is a popular chart pattern used to predict a reversal from a downtrend to an uptrend. Imagine it like a “W” shape on the chart. It has three key parts:
- Left Shoulder: A dip in price followed by a recovery.
- Head: A deeper dip, showing the lowest point of the pattern.
- Right Shoulder: Another dip, but not as low as the head, followed by a rise.
When the price breaks above the neckline (a resistance level connecting the highs of the shoulders), it’s seen as a strong signal that the price might climb higher. In this case, the post highlights that Ethereum’s pattern played out “to perfection,” hitting a target price marked on the chart.
Ethereum’s Bullish Signal
The image shared by MartyParty shows Ethereum’s price action with the pattern clearly labeled. The chart indicates that after forming the right shoulder, the price broke through the neckline and surged toward a target zone labeled “$ETH.” This kind of movement is music to the ears of traders, as it suggests confidence in Ethereum’s future growth. Given that today is August 10, 2025, and the pattern has recently completed, many are wondering: could this be the start of a run toward new all-time highs?
Why This Matters for Blockchain Practitioners
If you’re into blockchain or trading meme tokens (hey, you’re on meme-insider.com, after all!), understanding technical analysis like this can give you an edge. Ethereum isn’t just a cryptocurrency; it’s the backbone of countless decentralized apps (dApps) and Layer 2 solutions. A bullish trend could mean more activity on the network, lower gas fees, and even a boost for related meme coins or projects built on Ethereum.
The thread also sparked some interesting replies. For instance, @Kevinlivin shared a chart of Ethereum’s ecosystem TPS (transactions per second), showing how Layer 2 solutions like Arbitrum and Base are scaling the network. This ties into the bigger picture—Ethereum’s growth could amplify the success of these scaling solutions, which is a hot topic in the blockchain space.
What’s Next for Ethereum?
So, is Ethereum headed for the moon, or could we see a correction? The X thread has mixed opinions. Some users, like @cryptozell74, hint at the next pattern being “more intriguing,” while others, like @martypartymus11, are asking if we’re in for an all-time high (ATH) or a pullback. As of 12:50 PM JST today, it’s too early to say for sure, but the inverse head and shoulders pattern is a promising sign for bullish traders.
Final Thoughts
Whether you’re a seasoned trader or just dipping your toes into the crypto waters, keeping an eye on patterns like this can help you stay ahead. The Ethereum inverse head and shoulders pattern is a great example of how technical analysis can guide your decisions. Head over to meme-insider.com for more insights on meme tokens and blockchain trends, and let us know your thoughts in the comments below!
Ready to dive deeper? Check out our knowledge base for more crypto tips and tricks!