Hey there, crypto enthusiasts! If you’ve been keeping an eye on the decentralized finance (DeFi) space, you’ve probably heard of DefiLlama, a go-to platform for tracking DeFi metrics. Recently, they dropped an eye-catching chart that maps out five years of DeFi growth, focusing on Total Value Locked (TVL), Decentralized Exchange (DEX) volume, and stablecoins. Let’s break it down and see what this data tells us about the wild ride of DeFi!
What’s in the Chart?
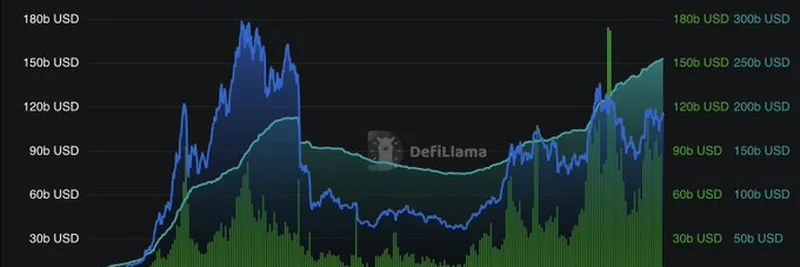
The chart, shared by DefiLlama on July 7, 2025, is a visual feast of data spanning from 2020 to 2025. Here’s a quick rundown of the key metrics:
- TVL (Total Value Locked): This is the total amount of assets locked in DeFi protocols, shown in a striking blue line. It’s a measure of how much trust and money is flowing into these decentralized platforms.
- DEX Volume: Represented by the green area, this shows the trading activity on decentralized exchanges over time. Think of it as the heartbeat of DeFi trading!
- Stablecoins: The teal area highlights the growth of stablecoins, which are cryptocurrencies pegged to assets like the US dollar to reduce volatility.
The Journey So Far
Let’s take a stroll through the timeline:
- 2020-2021: The DeFi boom kicked off with a bang! TVL skyrocketed as projects like Uniswap and Aave gained traction. You can see the blue line shooting up, reflecting the hype and new money pouring in. DEX volume also started picking up, showing more people were trading on these platforms.
- 2022: Things got a bit rocky. The crypto market faced a downturn, and the chart shows a dip in TVL. However, stablecoin usage held steady, proving their role as a safe haven during turbulent times.
- 2023-2024: A recovery phase began. TVL and DEX volume started climbing again, with stablecoins playing a bigger role. This period highlights the resilience of DeFi, even after market corrections.
- 2025: The latest data shows another upward trend, especially in TVL and DEX volume. That sharp spike toward 180 billion USD suggests we might be on the cusp of another DeFi bull run!
Why This Matters
So, why should you care about these numbers? For one, they show how DeFi is evolving from a niche experiment to a major player in the financial world. TVL tells us how much capital is at stake, while DEX volume indicates how active the ecosystem is. Stablecoins, on the other hand, are the glue holding it all together, offering stability in a volatile market.
If you’re a blockchain practitioner or just curious about meme tokens and crypto trends, this chart is a goldmine. It’s a snapshot of where the money’s going and what’s driving growth. Plus, with platforms like DefiLlama providing transparent data, you can make informed decisions about where to dive in next.
What’s Next for DeFi?
Looking at the chart, the recent uptick in 2025 is exciting. It could mean more innovation, new projects, or even a surge in meme token-related DeFi plays—something we at Meme Insider love to explore! However, the market’s history of ups and downs reminds us to keep an eye on risks like regulatory changes or security issues.
What do you think? Are you bullish on DeFi’s future based on this data? Drop your thoughts in the comments, and let’s chat about how these trends might shape the next big thing in crypto!