Hey there, crypto enthusiasts and blockchain practitioners! If you’ve been keeping an eye on the financial markets, you’ve probably noticed how liquidity—the lifeblood of any economy—can sway everything from stock prices to meme token values. Today, we’re diving into a fascinating X post by MartyParty that dropped on August 2, 2025, giving us a sneak peek into the global liquidity landscape. Let’s break it down step by step, especially since this could impact the meme token ecosystem you care about at meme-insider.com.
What’s the Buzz About Global Liquidity?
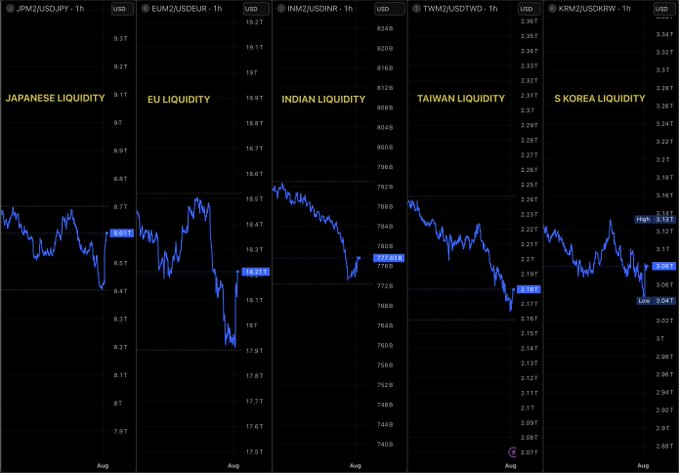
The post highlights a "Global Liquidity Update" and shares charts showing liquidity trends across several key regions: Japan, the European Union (EU), India,*******, and South Korea. Liquidity, in simple terms, is the amount of money flowing through an economy that’s available for spending or investing. When liquidity rises, it often means more cash is circulating, which can boost markets—including the wild world of meme tokens!
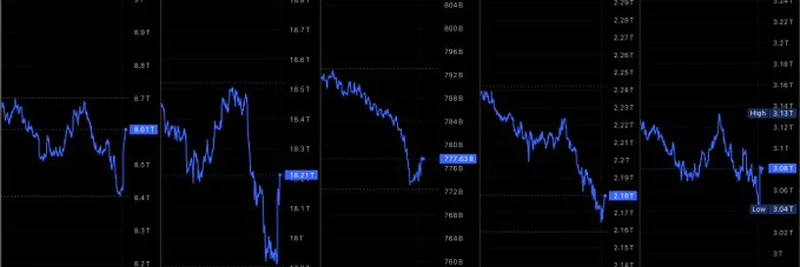
MartyParty’s update comes with two main visuals. The first set of charts (check out the image below) tracks the liquidity of individual regions over a short time frame, while the second chart gives a broader view of global liquidity trends throughout 2025. Let’s dig into what these charts are telling us.
<Image src="https://pbs.twimg.com/media/GxW5We5WcAAhN6X.jpg?format=jpg&name=small" alt="Liquidity charts for Japan, EU, India,
Message contains too many sensitive words!, and South Korea" width={800


