Hey there, crypto enthusiasts and gold bugs! If you’ve been scrolling through X lately, you might have stumbled upon an intriguing post by MartyParty (@martypartymusic) on August 2, 2025. This tweet dives into a fascinating comparison of Gold and Bitcoin price movements, using the Wyckoff method to highlight potential trends. Let’s break it down in a way that’s easy to digest, even if you’re new to trading or blockchain tech.
What’s the Buzz About?
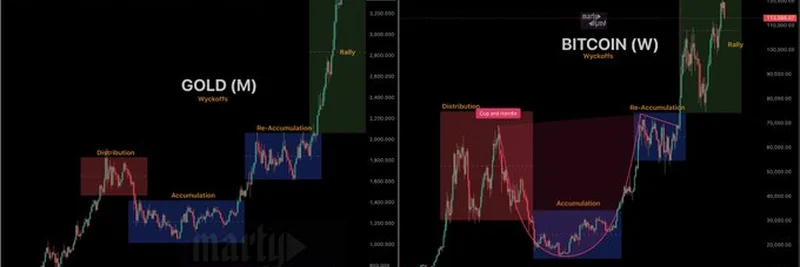
MartyParty shared two charts side by side, showing monthly (M) data for Gold and weekly (W) data for Bitcoin. Both charts are annotated with Wyckoff method phases—think of it as a roadmap for understanding market cycles. The Wyckoff method, developed by Richard Wyckoff, helps traders spot accumulation (buying zones), distribution (selling zones), and rallies or declines based on price action and volume.
- Gold (Monthly Chart): The chart highlights a re-accumulation phase around $2,000-$2,200, followed by a distribution phase and a recent rally pushing toward $3,600. This suggests Gold might be gearing up for more upward movement.
- Bitcoin (Weekly Chart): Bitcoin’s chart shows a cup-and-handle pattern (a bullish signal) after an accumulation phase, with a re-accumulation zone around $60,000-$80,000. The target? A potential climb to $125,000 or even $140,000.
These visuals are a goldmine (pun intended!) for anyone trying to predict where these assets might head next.
Why This Matters
Gold has long been seen as a "safe haven" asset, especially during economic uncertainty. On the other hand, Bitcoin is often dubbed "digital gold" due to its scarcity and growing acceptance. MartyParty’s analysis suggests both might be entering bullish phases, which could mean exciting times ahead for investors. But here’s the catch—crypto markets, including Bitcoin, are notoriously volatile, much like the meme coins we cover here at Meme Insider. Gold, while steadier, can also swing based on macroeconomic factors.
The Wyckoff method’s focus on accumulation and distribution gives us clues about when smart money is entering or exiting. For instance, the re-accumulation zones indicate a pause where buyers might be building positions before the next big move.
What the Community Thinks
The thread sparked some fun reactions. @333blacksea chimed in with a meme from The Lord of the Rings, humorously showing reluctance to sell Bitcoin profits—classic crypto trader vibes! Meanwhile, @suircra plugged a Telegram channel for trading tips, showing how these analyses can inspire action. It’s a mix of serious strategy and community banter, which is what makes X such a lively space for market discussions.
Takeaways for Blockchain Practitioners
If you’re into blockchain or trading, this analysis is a great starting point. Here’s how you can apply it:
- Watch the Levels: Keep an eye on Gold’s $3,600 and Bitcoin’s $125,000 targets. These are potential resistance zones where prices might stall or break through.
- Diversify Smartly: With both assets showing bullish signs, consider how they fit into your portfolio. Gold offers stability, while Bitcoin adds growth potential.
- Stay Updated: Market trends evolve fast. Follow accounts like MartyParty on X or check out our knowledge base for the latest insights on crypto and meme tokens.
Final Thoughts
MartyParty’s Gold vs Bitcoin comparison is a snapshot of where these markets might be headed in August 2025. Whether you’re a seasoned trader or just dipping your toes into crypto, understanding these patterns can give you an edge. Got questions or your own take? Drop a comment below or join the conversation on X. And if you’re curious about meme coins or other blockchain trends, we’ve got you covered right here at Meme Insider!