If you’ve been keeping an eye on the crypto world, you might have stumbled across an intriguing X post by MartyParty (@martypartymusic) on August 4, 2025. The post dives into the relationship between Bitcoin’s price and global liquidity, backed by a striking chart that’s got the community buzzing. As someone who’s spent years at CoinDesk and now helps run the show at Meme Insider, I couldn’t resist breaking this down for you in a way that’s easy to grasp—whether you’re a seasoned blockchain pro or just dipping your toes into the crypto waters.
What’s the Big Deal with Bitcoin and Global Liquidity?
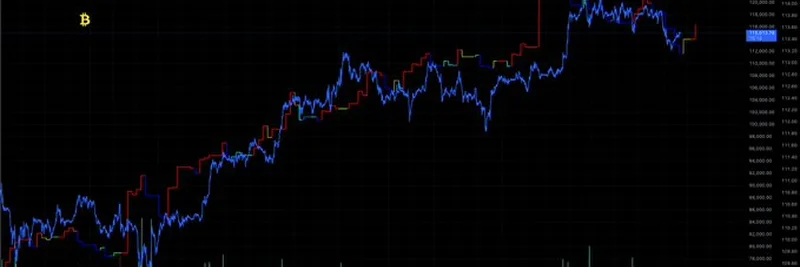
MartyParty’s post highlights a fascinating correlation: Bitcoin’s price seems to dance to the tune of global liquidity, with the red line on the chart representing global liquidity lagged by 84 days. In simple terms, global liquidity refers to the amount of money flowing through the world’s economies, often influenced by central banks’ policies like printing more money or adjusting interest rates. The chart suggests that when there’s more cash sloshing around globally, Bitcoin tends to see a price boost a few months later.
This isn’t just a random observation. Many in the crypto space believe Bitcoin acts like a “risk asset”—something investors flock to when they feel confident and have extra cash to spend. The lagged effect of 84 days could point to the time it takes for these liquidity changes to ripple through markets and impact Bitcoin’s value. It’s a bit like watching a wave build up before it crashes on the shore!
Breaking Down the Chart
The image MartyParty shared shows Bitcoin’s price (in blue) climbing over time, with the red line (global liquidity) following a similar upward trend, albeit with that 84-day delay. You can see some key moments where the two lines align, especially during big price surges. For example, if global liquidity spiked in April, you might notice Bitcoin’s price picking up around June or July. This lag could be a handy tool for traders looking to predict future movements—though, of course, it’s not a crystal ball!
The chart also hints at some recent dips, which might reflect a slowdown in global liquidity or other market forces at play. It’s a reminder that while liquidity is a big player, it’s not the only factor driving Bitcoin’s wild ride.
What Are People Saying?
The X thread sparked a lively discussion. Some users, like @metarizon_eth, are eager to know “where we go next,” while others, like @theHYPEconomist, are curious about why that 84-day lag seems to shift. Comments like @vasa002’s nod to the “solid correlation” show that many in the community see this as a valuable insight. It’s clear this topic has legs, with folks debating whether central banks or market psychology are pulling the strings behind Bitcoin’s price.
Why This Matters for Meme Tokens and Beyond
At Meme Insider, we’re all about keeping you in the loop on the latest crypto trends, and this Bitcoin-liquidity link has ripple effects beyond the big dog of crypto. Meme tokens, those quirky community-driven coins like Dogwifhat or MoonBull, often ride the coattails of broader market sentiment. If global liquidity fuels a Bitcoin bull run, it could spill over into the meme coin space, boosting projects with strong community hype.
For blockchain practitioners, understanding this relationship can sharpen your strategy. Watching global liquidity trends—maybe even setting up alerts for those 84-day lags—could give you an edge when timing your investments or building new projects. It’s all about staying ahead in a market that never sleeps!
The Takeaway
MartyParty’s post is a goldmine for anyone trying to wrap their head around Bitcoin’s price swings. The idea that global liquidity, lagged by 84 days, might predict Bitcoin’s moves is both exciting and a little mind-boggling. While it’s not a guaranteed formula (crypto loves to throw curveballs!), it’s a trend worth watching. So, next time you see a liquidity spike, keep an eye on your Bitcoin charts—and maybe your meme token portfolio too!
What do you think about this correlation? Drop your thoughts in the comments, and let’s keep the conversation going. For more deep dives into crypto trends, stick with us at Meme Insider!
