If you’re diving into the wild world of meme tokens like Fartcoin, understanding liquidity pool (LP) positions can give you a serious edge. Recently, a tweet from Nico (@nicodotfun) caught our attention, breaking down how to analyze LP positions to spot key trading opportunities. Let’s unpack this strategy step-by-step, tailored for blockchain enthusiasts and traders looking to level up their game in 2025.
What Are Liquidity Pools and Why They Matter
First things first: liquidity pools are like the fuel tanks of decentralized exchanges (DEXs) such as Orca, built on the Solana blockchain. They’re where traders deposit pairs of tokens (like Fartcoin and USDC) to enable smooth buying and selling. The deeper the pool, the easier it is to trade without causing wild price swings. Nico’s tweet highlights how analyzing these pools can reveal where the “bulk of liquidity” sits, which is a game-changer for spotting support and resistance levels.
Decoding the Fartcoin LP Analysis
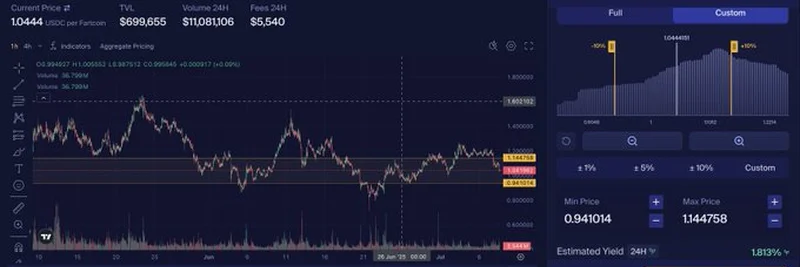
The image Nico shared shows a trading interface for Fartcoin/USDC, with a chart and a “Create Position” panel. Here’s what stands out:
- Current Price: Sitting at 1.0444 USDC per Fartcoin, with a 24-hour trading volume of $11.08M.
- Liquidity Distribution: The chart marks price ranges where liquidity is thickest (more buyers and sellers) and thinnest (fewer participants). For example, the range around 0.941014 to 1.14478 USDC shows varying liquidity depths.
- Support and Resistance: Thick liquidity areas often act as support (where prices tend to bounce back up) or resistance (where prices struggle to break through). Thin areas might signal potential breakout zones.
Nico suggests using this data as “additional confirmation” for your trades. Imagine you’re eyeing a dip—seeing a thick liquidity zone below the current price could mean a safer entry point, as more traders are likely to step in.
How to Analyze LP Positions Like a Pro
Ready to put this into action? Here’s a simple guide:
- Check the Platform: Head to a DEX like Orca and look at the LP data for your token pair. The interface will show liquidity ranges and volume.
- Identify Key Zones: Look for where liquidity clusters—those are your support and resistance levels. In the Fartcoin chart, the range around 1.041014 to 1.14478 USDC looks significant.
- Combine with Charts: Use the price chart to see how the token has reacted at these levels in the past. Has it bounced or broken through?
- Manage Risk: Set stop-loss orders below support levels to protect yourself if the market turns. The tweet’s focus on confirmation means don’t rush—double-check your analysis.
Why Orca and Fartcoin?
Orca stands out because it’s built for speed and low fees on Solana, making it a hotspot for meme token trading. Fartcoin, with its quirky name, is a prime example of how meme tokens can gain traction—and volatility. By analyzing LP positions, you’re tapping into the crowd’s behavior, which is especially useful for these unpredictable assets.
Takeaways for Meme Token Traders
Nico’s tip is a goldmine for anyone trading meme tokens in 2025. By studying where liquidity is concentrated, you can make smarter calls on when to buy or sell. Whether you’re a newbie or a seasoned trader, this approach adds a layer of insight beyond basic price charts. Head over to meme-insider.com for more tips on navigating the meme token landscape, and don’t forget to connect your wallet to start experimenting!
Got questions or want to dive deeper? Drop a comment below—we’d love to hear your thoughts!


