In the fast-paced world of crypto and macroeconomics, sometimes a tiny mistake can send ripples across global markets. That's exactly what happened when Japan's Central Bank reportedly "fat-fingered" their monthly M2 money supply figure—essentially adding an extra decimal point by accident. This error, later corrected, threw off all the major global liquidity indicators, creating a chart that looked like liquidity was about to skyrocket off the charts.
For those new to the term, M2 money supply is basically a measure of the money circulating in an economy, including cash, checking deposits, and easily convertible near-money like savings accounts. It's a key metric for gauging how much liquidity—or available cash—is sloshing around, which directly influences asset prices, including cryptocurrencies and meme tokens.
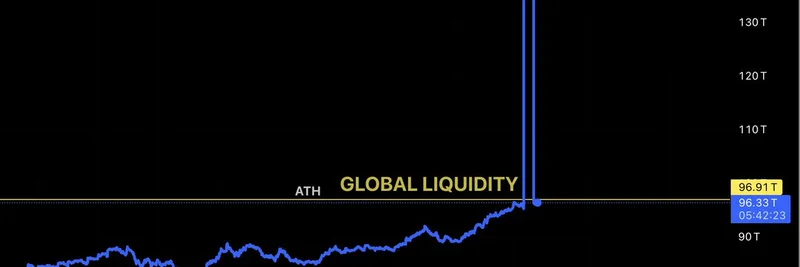
The tweet from MartyParty (@martypartymusic), a well-known crypto commentator and macro analyst, highlighted this blunder with a striking chart showing a dramatic spike in global liquidity, labeled "ATH" for all-time high. But was it a genuine signal or just a data glitch? MartyParty playfully speculated: could this be foreshadowing a real 10x increase in global liquidity on the horizon?
What Really Happened with Japan's M2 Data
According to the post, the Bank of Japan (BOJ) initially reported an inflated M2 figure due to that misplaced decimal, which artificially pumped up global liquidity readings. Once corrected, the charts normalized, but not before causing a stir among traders and analysts. In crypto circles, where liquidity is king, such distortions can lead to knee-jerk reactions—people might misinterpret the data as a bullish signal for risk assets like Bitcoin, Ethereum, and especially volatile meme tokens.
Meme tokens, those community-driven coins often inspired by internet jokes or viral trends (think Dogecoin or newer ones like PEPE), thrive in high-liquidity environments. When there's more money flowing into markets, speculative assets get a massive boost because investors are more willing to take risks. A real 10x liquidity surge? That could mean moonshots for meme coins, as excess capital chases high-reward plays.
Implications for Meme Token Traders
If this error is any indication, it underscores how interconnected global economies are with crypto. Japan's monetary policy decisions, like those of the Federal Reserve or European Central Bank, can indirectly pump or dump meme token prices. For instance, looser policies (more liquidity) often lead to "risk-on" modes where meme coins explode in value due to FOMO (fear of missing out).
But let's be real: this was likely just a clerical error, not a crystal ball prediction. Still, it serves as a reminder for blockchain practitioners to double-check data sources. Tools like TradingView or CoinMarketCap can help verify liquidity trends without falling for distorted charts.
Broader Crypto Market Context
In the broader scheme, global liquidity has been on an upward trajectory since 2022, as seen in the corrected charts. With ongoing debates about interest rate cuts and quantitative easing, meme token enthusiasts should keep an eye on central bank announcements. Events like this Japan mishap highlight the fragility of data-driven trading— one decimal can flip narratives overnight.
For meme token holders, the key takeaway? Stay informed, but don't chase every spike. Use resources from sites like Meme Insider to build a solid knowledge base on how macro factors influence your favorite tokens.
As MartyParty's tweet gained traction with over 25k views and sparked discussions in replies—ranging from laughs about "one little dot" breaking charts to serious talks on market fragility—it's clear that even errors can fuel valuable conversations in the crypto community. Whether it's a sign of things to come or just a funny blip, keeping tabs on liquidity will always be crucial for navigating meme token volatility.


