If you're diving into the world of meme tokens on Solana, you've probably heard of Kuro – that adorable cat-themed token that's been making waves. Recently, a seasoned liquidity provider shared a fascinating thread on X about their successful position on Kuro. Let's break it down step by step, explaining the key moves and why they worked. This isn't just a recap; it's a mini-masterclass in smart liquidity providing.
The Entry Point: Timing the Breakout
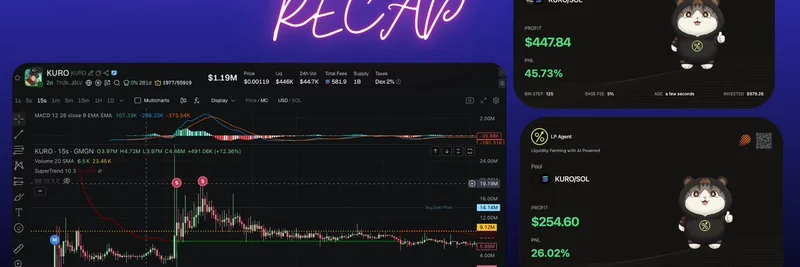
The trader, @coredotera, missed the initial surge in Kuro's price but didn't panic. Instead, they waited for a solid opportunity. That came in the form of a high-volume breakout, where trading volume spiked over $1 million per minute – a clear sign of strong interest.
They spotted this on the chart, marked by a yellow line, indicating bullish momentum building up. In simple terms, a breakout happens when the price pushes past a resistance level with conviction, often leading to further gains. By entering here, they positioned themselves for the upside without chasing the early hype.
Key Indicators: Following the Data
No successful trade happens without solid indicators, and this one was no exception. The trader relied on classics like volume profiles and MACD (Moving Average Convergence Divergence).
- Volume Rising into the Breakout: The volume profile showed increasing buys, confirming real demand behind the price move.
- Expanding MACD: This indicator measures momentum. When it expands and aligns with the volume moving average, it's a green light for a strong upward push.
These tools helped predict that the price would keep climbing, setting the stage for their liquidity strategy.
For newcomers, MACD is like a speedometer for price trends – it tells you if the momentum is accelerating or slowing down. Pairing it with volume ensures you're not just seeing noise but actual market strength.
Volatility Strategy: The Curve Position Play
Here's where it gets interesting. The trader used a "curve position" strategy on Meteora's DLMM (Dynamic Liquidity Market Maker) platform. They set a range around -20%, concentrating most liquidity at the top end.
Why? The bullish indicators suggested the price would trend higher. In a curve setup:
- More liquidity at the top means better fees from sells near the peak.
- Less at the bottom reduces exposure if the price dips temporarily.
This paid off handsomely, as seen in their positions racking up profits like $447.84 (46.73% PNL) and $254.60 (26.02% PNL).
The key takeaway? Match your strategy to the market's direction. If momentum is up, bias your liquidity upward to capture more fees without getting stuck in a downtrend.
Understanding the Risks
Liquidity providing isn't risk-free, and the trader was upfront about it. With a curve strategy:
- If the price drops out of range downside, you could face heavy impermanent loss (IL) – that's when the value of your pooled assets changes relative to holding them separately.
- To mitigate, they stick to strict entry conditions. If it's too late or the setup isn't perfect, they skip it entirely.
This disciplined approach is crucial in volatile meme token markets, where prices can swing wildly.
Wrapping It Up: Lessons for Meme Token Enthusiasts
In the end, this Kuro position was a win, thanks to patient entry, data-driven decisions, and a tailored volatility strategy. If you're into liquidity providing on Solana, check out resources like LP Army for more tips. Tools from Meteora AG make it easier to implement advanced setups like DLMM.
Meme tokens like Kuro show how fun and profitable the space can be, but always remember: do your research, manage risks, and never force a trade. What's your take on this strategy? Have you tried curve positions yourself?
For more insights on meme tokens and blockchain trends, stick around on Meme Insider – your go-to hub for all things crypto memes.