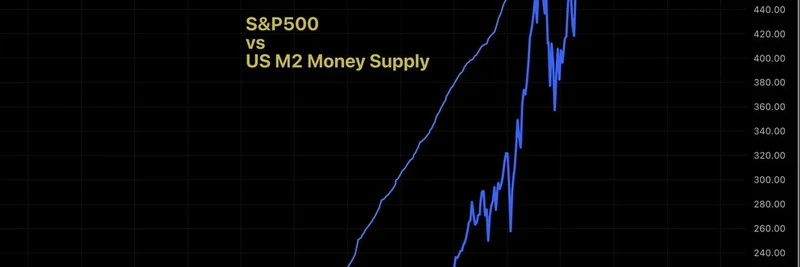
In the fast-paced world of crypto, where meme tokens can skyrocket or plummet overnight, keeping an eye on broader economic signals is key. Recently, crypto commentator and macro analyst MartyParty shared a compelling chart on X (formerly Twitter) comparing the S&P 500 to the US M2 money supply. This isn't just stock market trivia—it's a window into how money flowing through the economy could influence everything from Bitcoin to your favorite dog-themed meme coin.
Decoding the Chart: Stocks and Money Supply
Let's break it down simply. The S&P 500 is a stock market index tracking the performance of 500 large companies listed on US exchanges—think Apple, Microsoft, and Tesla. It's often seen as a barometer for the overall health of the US economy. On the other hand, M2 money supply measures the amount of money circulating in the economy, including cash, checking deposits, and easily convertible savings. When M2 grows, it typically means more liquidity, which can fuel asset prices like stocks and, by extension, cryptocurrencies.
MartyParty's chart overlays the S&P 500's price action (the wiggly blue line at the bottom) with the M2 money supply (the smoother upward-trending line). Notice how the stock market's ups and downs often mirror changes in money supply? The bars at the bottom likely represent monthly changes or growth rates, with that purple lightning bolt highlighting a recent shift—perhaps a contraction or slowdown in M2 growth. This visual suggests a strong correlation: when the money printer goes "brrr," asset prices tend to climb.
Why This Matters for Meme Tokens
Meme tokens, like Dogecoin or newer entrants on Solana and Ethereum, thrive on hype, community, and liquidity. They're not backed by traditional fundamentals but by viral momentum and easy access to capital. In a macro environment where M2 is expanding, more dollars chase fewer assets, potentially inflating prices across the board—including speculative ones like memes.
But here's the twist: if M2 growth stalls or reverses (as some economists predict amid inflation fights), it could signal tougher times ahead. For meme coin holders, this might mean increased volatility or even a pullback. MartyParty, known for his crypto insights and as host of The Office Space podcast, often ties these macro views to blockchain trends. His tweet sparked discussions in the replies, with some users recalling his past Bitcoin price calls and others hyping the chart's implications.
Connecting the Dots to Crypto
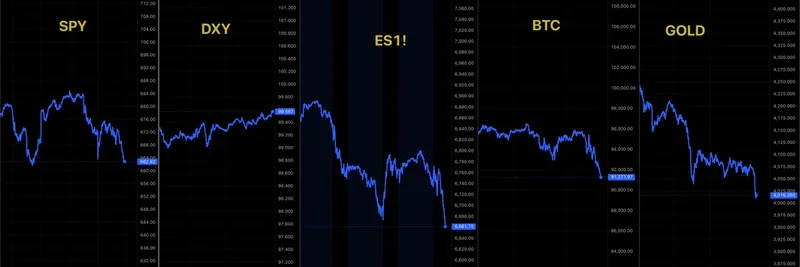
Crypto markets don't exist in a vacuum. The S&P 500's performance often correlates with Bitcoin's, which in turn influences altcoins and memes. If money supply keeps pumping, we could see another bull run, boosting meme token launches and trading volumes. Tools like DexScreener and Pump.fun make it easier than ever to jump into memes, but savvy traders watch these macro indicators to time their moves.
Remember, this is education, not financial advice—MartyParty's bio says it best. If you're building in blockchain or just HODLing your favorite meme, charts like this remind us to zoom out and consider the bigger picture.
Looking Ahead: Meme Tokens in a Changing Economy
As we head into 2026, with potential policy shifts under new administrations, monitoring M2 could be crucial. Will it resume its upward march, or are we in for a period of tightening? For meme insiders, this could mean scouting resilient communities or diversifying into utility-focused tokens.
Stay tuned to Meme Insider for more breakdowns on how macro events shape the meme token landscape. What do you think—bullish or bearish on memes amid these trends? Drop your thoughts in the comments!