In the wild world of crypto, where meme tokens can skyrocket or crash in a heartbeat, understanding liquidation levels can be your secret weapon against getting wrecked. Recently, crypto commentator MartyParty shared a insightful thread on X about the LQL Liquidation Levels Chart, highlighting how traders can navigate the market smarter after Bitcoin's recent 35% pullback. If you're dabbling in meme coins like those on Solana or Ethereum ecosystems, this advice hits home—meme tokens are notoriously volatile, making leveraged trades a high-stakes game.
MartyParty points out that a staggering $500 billion has been wiped out through liquidations this year alone. That's a lot of capital vanishing because of overleveraged positions. The key takeaway? Don't be a victim. Instead, use tools like the LQL chart to time your entries and exits with precision.
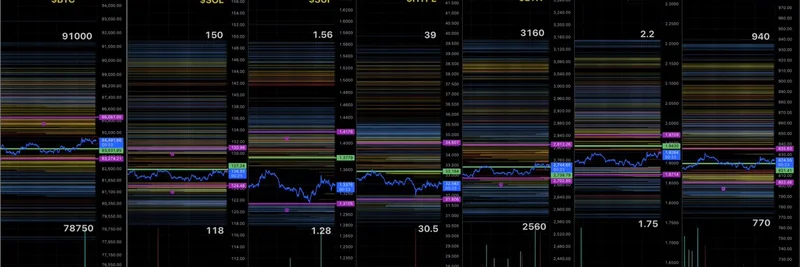
So, what exactly is this LQL Liquidation Levels Chart? It's a visual map of major Layer 1 network tokens—like Bitcoin (BTC), Solana (SOL), Ethereum (ETH), and others—showing their current exchange prices alongside the price points where overleveraged traders will get liquidated. Liquidation happens when a leveraged position moves against you enough that the exchange forcibly closes it to recover the borrowed funds. For meme token traders, who often ride the hype waves on platforms like Solana (home to many viral memes), spotting these levels can help you avoid jumping in too early or holding too long.
Here's how to put it into practice, straight from MartyParty's wisdom:
Patience is Key: The chart reveals the trading range and high-probability spots for entries, exits, stop losses, and take profits. Only go long (betting on price increases) at the low white numbers—these are the bottom liquidation levels where most overleveraged longs get flushed out. That's your green light for entry, as the market often rebounds from there.
Take Profits Wisely: Don't hodl forever. Lock in gains and wait for the next setup. Meme tokens, with their pump-and-dump tendencies, are perfect examples where greed can turn profits into dust.
Cut Losses Quickly: If a trade goes red, exit immediately. Re-enter at a better spot. This discipline is crucial in the meme space, where narratives can flip overnight.
Always Use Stop Losses: Trail them behind winning trades to protect your capital. Once your stop loss is "in the money" (above your entry for longs), you're playing with house money.
The same principles apply if you're shorting (betting on price drops), just in reverse. Remember, this chart is dynamic—it updates as new trades come in, acting like a live market map. Exchanges often hunt for those red and yellow lines, where the most aggressive degens (degenerate gamblers) are positioned.
A quick PSA from the thread: These levels are approximations based on data from top trading platforms, not guarantees. Stick to low leverage (1-5x), trade only 1-5% of your capital per position, and focus on building spot holdings in self-custody wallets. Avoid predatory exchanges that might manipulate prices to trigger liquidations.
While the chart focuses on blue-chip tokens like BTC and ETH, the strategy translates beautifully to meme tokens. Meme coins often follow the broader market sentiment, especially during pullbacks. If Bitcoin's dipping and liquidating longs, expect ripple effects in meme land—use these levels to gauge when the bleed might stop and the fun resumes.
For more on this, check out the original thread on X here. MartyParty's take reminds us that trading isn't about opinions; it's about data. In the meme token arena, where community hype drives prices, combining this technical edge with on-chain analysis can supercharge your game.
Stay sharp, traders— the bull market's far from over, but only if you play it smart.