Michael Saylor, the outspoken Bitcoin advocate and founder of Strategy (formerly known as MicroStrategy), just dropped an eye-opening chart on X that breaks down volatility in what he calls the "Digital Stack." If you're in the crypto space, especially dealing with meme tokens or blockchain investments, understanding volatility is key—it's basically how wildly prices swing over time, and it can make or break your portfolio.
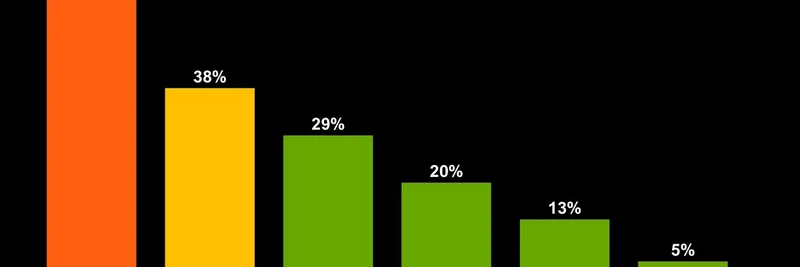
In his tweet, Saylor highlights the 30-day historical volatility for a range of assets: starting with MSTR (Strategy's equity) at a hefty 55%, down to BTC (Bitcoin) at 38%, and then Strategy's preferred stock offerings—STRK at 29%, STRD at 20%, STRF at 13%, and STRC at a super low 5%. This visual stacks them like a risk ladder, showing how you can layer your investments from high-volatility equity to more stable credit instruments, all backed by Bitcoin.
What Does This Chart Really Mean for Crypto Enthusiasts?
Historical volatility measures past price fluctuations—think of it as a rearview mirror on how bumpy the ride has been. For meme token traders, who often chase high-vol pumps, this chart is a reality check. Bitcoin itself sits at 38%, which is volatile compared to traditional stocks but tame next to many memes that can swing 100% in a day. Saylor's point? The Digital Stack offers ways to tap into Bitcoin's growth with varying risk levels.
- MSTR (Equity): At 55%, this is the wildest ride. As Strategy's stock, it's leveraged to Bitcoin holdings, meaning it amplifies BTC's moves—great for gains, but brutal on dips.
- BTC (Capital): The OG crypto at 38%. It's the core asset powering everything else here.
- STRK, STRD, STRF, STRC (Preferred Stocks): These are Strategy's Bitcoin-backed securities, designed like a yield curve for crypto. STRC, with just 5% volatility, acts like stable credit, offering yields (around 8-12% based on recent offerings) with minimal swings. They're perpetual preferred stocks, meaning they pay dividends funded by Bitcoin, appealing for those wanting steady income without selling their BTC.
Saylor's bio even plugs these—$MSTR, $STRC, $STRK, $STRF, $STRD—tying into Strategy's website, where you can dive into metrics like market caps and returns.
Why This Matters in the Meme Token World
Meme tokens thrive on hype and volatility, but Saylor's approach shows a more structured side of crypto finance. If you're building a balanced portfolio, blending high-risk memes with lower-vol assets like these preferred stocks could hedge against crashes. For instance, while a meme might tank 50% overnight, something like STRC offers stability, backed by Strategy's massive Bitcoin treasury.
This tweet comes amid market dips, as seen in replies calling it a "buying opportunity" or even critiquing timing. But for blockchain practitioners, it's a reminder: volatility isn't just risk—it's opportunity, especially when layered smartly.
Key Takeaways for Investors
To wrap it up, Saylor's chart isn't just data; it's a blueprint for navigating crypto's ups and downs. Whether you're HODLing BTC, trading memes, or eyeing yields, understanding this stack can level up your strategy. Check out Strategy's offerings for more on how they're innovating with Bitcoin-backed finance—it's the kind of knowledge that keeps you ahead in this fast-paced world.