In the fast-paced world of cryptocurrency, where meme tokens can skyrocket or plummet based on a single viral post, innovative ideas are always bubbling up on platforms like X (formerly Twitter). A recent tweet from crypto enthusiast Edgar Pavlovsky caught our eye at Meme Insider, sparking thoughts on how we could blend social media chatter with trading tools to give blockchain practitioners a real edge.
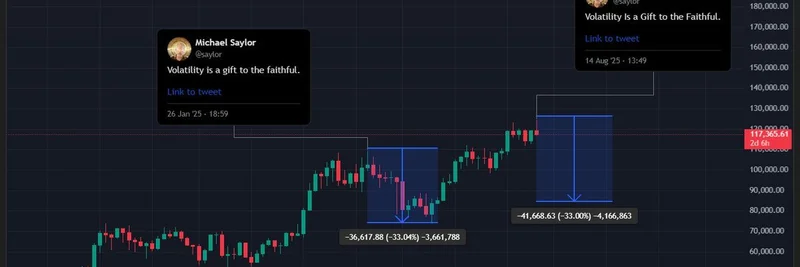
Edgar, known for his work in convexity and projects like Dark Research AI, quoted a humorous yet insightful post about Michael Saylor's timeless advice on Bitcoin volatility. The original post by @beast_ico highlighted Saylor's tweets overlaid on a Bitcoin chart, showing dips annotated with his motivational quips like "Volatility is a Gift to the Faithful." It's a perfect example of how social sentiment ties directly into market movements—something meme token traders live and breathe every day.
Edgar's take? "We should productize Twitter + charts. There's a crazy amount of opportunity to improve on 1) technical analysis 2) chart visualizations." Simple, but profound. For those new to the lingo, technical analysis (TA) involves studying price charts and patterns to predict future moves, while chart visualizations are the graphical tools that make data easier to digest. In the meme token space, where hype from influencers can trigger massive pumps, integrating real-time X posts directly into charting software could be a game-changer.
Why This Matters for Meme Tokens
Meme tokens like Dogecoin or newer entrants often derive their value from community buzz rather than fundamentals. A viral thread on X can send prices soaring, but spotting these moments early requires sifting through endless noise. Imagine a platform where you pull up a chart for a hot meme coin, and it's automatically annotated with relevant tweets, threads, or even sentiment scores from key opinion leaders. No more switching tabs between X and TradingView—everything in one seamless view.
This integration could enhance TA by layering social data onto traditional indicators like moving averages or RSI (Relative Strength Index, a tool measuring overbought or oversold conditions). For instance, if a meme token's chart shows a bullish flag pattern coinciding with a spike in positive X mentions, that's a stronger signal to buy. Edgar's point about improving visualizations hits home too; think interactive charts where you hover over a price spike and see the exact tweet that caused it, complete with engagement metrics.
Opportunities on the Horizon
The crypto community is already experimenting with similar ideas. Tools like Dune Analytics allow for on-chain data visualization, but adding a social layer could unlock next-level insights. For meme token hunters, this means better risk management in volatile markets—remember, volatility isn't just a Bitcoin thing; it's the lifeblood of memes.
At Meme Insider, we're all about equipping you with knowledge to navigate this wild ecosystem. If productizing X with charts becomes reality, it could democratize advanced trading strategies, making them accessible beyond pro traders. Keep an eye on developers in the space; projects focusing on AI-driven sentiment analysis might lead the charge.
For now, check out the original thread on X and let us know your thoughts. How would you use integrated social charts in your meme token plays? Drop a comment below or hit us up on social.
Stay tuned for more updates on meme token trends and tools at meme-insider.com.


