If you’ve been keeping an eye on the crypto world, you might have noticed a buzz around a recent tweet from MartyParty (@martypartymusic) on July 25, 2025. The post dives into a basic Bitcoin technical analysis (TA) focusing on a 50% pullback—a concept that’s got traders talking. Let’s break it down in a way that’s easy to grasp, even if you’re new to the crypto game.
What’s a 50% Pullback?
A 50% pullback is a key level in technical analysis where a cryptocurrency’s price drops to half the height of its recent upward move before potentially bouncing back. In MartyParty’s tweet, the chart highlights that Bitcoin’s price retraced exactly 50% of its move from July 10, 2025. This isn’t just a random number—it’s a psychological and mathematical point that often acts as support or resistance, influencing trader behavior.
The chart, sourced from a tool showing liquidation levels (more on that later), shows Bitcoin’s price peaking around $115,540.01 before dropping to a level that aligns with this 50% mark. For those unfamiliar, support is like a floor where buyers tend to step in, while resistance is a ceiling where sellers might push back.
The Chart Breakdown
The image MartyParty shared is a goldmine of info. Here’s what stands out:
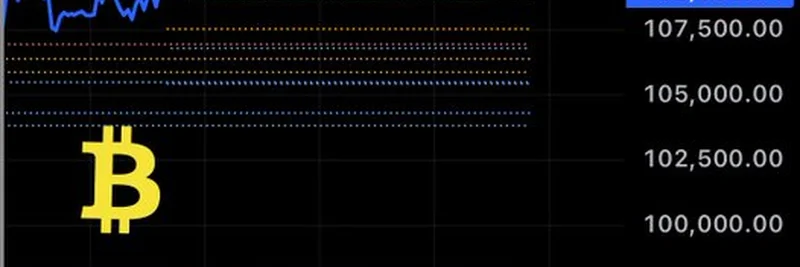
- Price Movement: The blue line traces Bitcoin’s price over a 4-hour (4H) timeframe, showing a sharp rise and an equally sharp drop.
- Liquidation Levels: Those dotted lines (courtesy of Leviathan on the NQ21 PRO platform) indicate where leveraged positions might get wiped out if the price hits those points. Key levels include $108,985.74, $105,000, and $100,000.
- Current Price: At the time of the tweet (02:50:24 on July 25), Bitcoin was hovering around $122,788.92, suggesting a recovery after the pullback.
This setup is a classic move in crypto markets. When prices drop to these liquidation zones, it often “flushes out” over-leveraged traders—those who borrowed heavily to bet on Bitcoin’s rise—causing a cascade of sell-offs. But it also sets the stage for a potential rebound if the support holds.
Why It Matters to Traders
The responses to MartyParty’s tweet show a mix of excitement and strategy. Some, like @sladkyeth, point out that this pullback likely took out over-leveraged long positions (bets on the price going up). Others, such as @suircra, are optimistic, predicting an “open skies” move to $150,000. Meanwhile, @mustafa_kamal highlights the $105,000 and $100,000 levels as “hot zones” to watch—areas where the market might pivot.
For traders, this 50% pullback is a signal. It’s a chance to buy low if you believe in the upward trend or to brace for more drops if the support fails. The Fibonacci 50% retracement, as noted in the tweet, isn’t just a technical tool—it’s a reflection of human psychology in the market. Traders often act predictably at these levels, making it a self-fulfilling prophecy.
What’s Next for Bitcoin?
So, where’s Bitcoin headed after this pullback? The chart and community reactions suggest a few possibilities:
- Upside Potential: If the $108,985.74 level holds as support, we could see Bitcoin climb back toward its recent high or even beyond, as some predict a push to $150,000.
- Downside Risk: A break below $100,000 might trigger more liquidations, potentially dropping to $95,000 or lower, as seen in the chart’s lower levels.
This kind of analysis is why tools like NQ21 PRO are popular among crypto enthusiasts—they help visualize where the market might turn. For meme token fans or blockchain practitioners, understanding these broader market movements can also inform strategies, especially if Bitcoin’s trends influence altcoins and meme coins.
Final Thoughts
MartyParty’s tweet is a snapshot of Bitcoin’s wild ride, blending technical analysis with real-time market psychology. Whether you’re a seasoned trader or just dipping your toes into crypto, watching these 50% pullback levels can offer valuable insights. Keep an eye on those liquidation zones and the community’s reactions—they’re a pulse on where the market might head next.
What do you think? Will Bitcoin bounce back or dip further? Drop your thoughts in the comments, and stay tuned to meme-insider.com for more crypto insights and meme token updates!