Hey there, crypto enthusiasts! If you’ve been scrolling through X lately, you might have stumbled upon a fascinating thread by MartyParty (@martypartymusic) posted on July 25, 2025. This tweet dives deep into Bitcoin trading basics, spotlighting the Wyckoff patterns and those intriguing 50% pullbacks in a bull market. Let’s break it down in a way that’s easy to grasp, even if you’re new to the crypto game.
What Are Wyckoff Patterns?
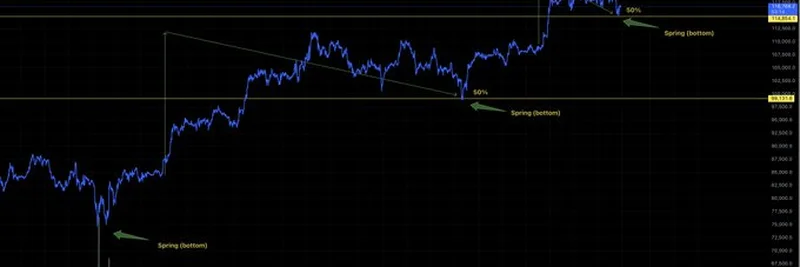
First off, the Wyckoff method is a trading strategy that helps predict price movements based on historical patterns. Developed by Richard D. Wyckoff in the early 20th century, it’s all about understanding how big players—think whales or institutions—move the market. One key pattern mentioned here is the Wyckoff Spring, which MartyParty pinpoints as happening on April 6th, 2025. This is like a fake-out dip in the price that tricks smaller traders into selling, only for the price to bounce back up as the big players buy in. Pretty clever, right?
The chart shared by MartyParty highlights a few “Spring (bottom)” points where Bitcoin’s price dipped before rebounding. These moments are critical for traders looking to jump in at a good entry point.
The 50% Pullback Phenomenon
Now, let’s talk about those 50% pullbacks. In a bull market (when prices are generally rising), Bitcoin doesn’t just go up in a straight line. Instead, it often pulls back by about half of its recent gain before climbing again. MartyParty suggests this is no accident—it’s a tactic by exchanges to flush out traders using leverage. Leverage is when you borrow money to amplify your trades, but if the price moves against you, exchanges can force you to sell at a loss. This creates those predictable dips, which repeat until the market hits its peak.
How Exchanges Play the Game
Here’s where it gets interesting. MartyParty argues that exchanges aren’t just neutral platforms—they set the prices and sell leverage through perpetual futures. When they see too many leveraged long positions (bets on the price going up), they let the price drop to trigger those sales, clearing out the weaker hands. Once the leverage traders are out, the price can climb higher. It’s like a strategic game of chess!
Global Liquidity and Timeframes
The thread also ties Bitcoin’s movements to global liquidity—the amount of money flowing through the world’s financial system. On high timeframes (like weekly or monthly charts), Bitcoin tends to follow these liquidity trends. On the flip side, low timeframes (daily or hourly charts) are better for spotting liquidation levels—those points where leveraged positions get wiped out. By watching both, you can time your trades like a pro.
Why This Matters in 2025
With the post dated just hours before I’m writing this (it’s 03:11 AM +07 on July 26, 2025), this analysis feels super timely. Bitcoin’s been on a wild ride, and understanding these patterns could help you navigate the ups and downs. Whether you’re a seasoned trader or just dipping your toes into cryptocurrency trading, keeping an eye on Wyckoff Springs and 50% pullbacks might give you an edge.
Final Thoughts
MartyParty’s thread has sparked some buzz, with users like @Trader_Natasha0 and @LanskiHand96548 chiming in with praise. It’s a reminder that the crypto market is as much about psychology and strategy as it is about technology. If you’re into meme tokens or broader blockchain trends, check out meme-insider.com for more insights to level up your game. What do you think—will these patterns hold true as we move through 2025? Drop your thoughts in the comments!