Hey there, crypto enthusiasts! If you’ve been keeping an eye on the latest buzz on X, you might have stumbled across an intriguing post from Token Terminal that dives into Ethereum’s financial metrics. The chart they shared highlights the relationship between Ethereum’s fully diluted market cap and its Total Value Secured (TVS), suggesting that TVS might be setting a floor for ETH’s valuation. Let’s break this down in a way that’s easy to digest, even if you’re new to the blockchain world.
What’s Fully Diluted Market Cap?
First off, let’s talk about the fully diluted market cap. This is a fancy term that basically estimates what Ethereum’s total market value would be if all possible ETH tokens were in circulation. Imagine it like this: if every single ETH that could ever exist was out there in the market, this number tells you its worth based on the current price. It’s calculated by multiplying the current price of ETH (around $3,762.56 as of today, July 26, 2025) by its maximum supply. This gives us a big-picture view, though it doesn’t always predict the future price accurately since demand and supply can fluctuate wildly.
What About Total Value Secured (TVS)?
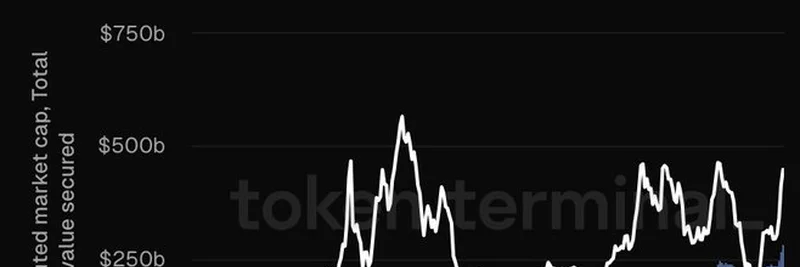
Now, let’s move to TVS, which stands for Total Value Secured. This metric shows the total U.S. dollar value of user funds locked into applications on the Ethereum blockchain—think decentralized finance (DeFi) platforms, lending protocols, and more. The chart shows TVS as a shaded area, and you can see it’s been a steady foundation beneath the fully diluted market cap line. Those orange arrows point to moments where TVS seems to act like a safety net, supporting ETH’s value even when the market gets rocky.
Why Does This Matter?
The key takeaway from Token Terminal’s post is that TVS might be setting a “floor” for ETH’s valuation. In simple terms, as long as people are locking up funds in Ethereum-based apps, it creates a kind of demand that helps keep ETH’s price from dropping too low. This is huge for DeFi and even real-world assets (RWAs) on Ethereum, as it shows the network’s growing utility beyond just trading.
For instance, the chart shows a spike in TVS around early 2022, aligning with the rise of DeFi’s popularity. Even with market dips, the locked value didn’t crash, suggesting Ethereum’s ecosystem is resilient. Fast forward to 2024, and you can see another uptick—could this be tied to new DeFi innovations or RWAs like tokenized real estate? It’s a sign that Ethereum isn’t just a cryptocurrency; it’s becoming the backbone of a decentralized financial system.
What This Means for Blockchain Practitioners
If you’re a blockchain developer or investor, this insight is gold. The growing TVS indicates that Ethereum’s network is secure and valuable, which could influence your next project or investment decision. Want to build a DeFi app? Ethereum’s stability might be your go-to. Curious about meme tokens or other crypto trends? Check out Meme Insider for the latest scoops!
Final Thoughts
This chart from Token Terminal isn’t just a pretty picture—it’s a window into how Ethereum’s value is tied to its real-world use. As TVS grows, it could keep pushing ETH’s floor higher, making it a key player in the crypto space. What do you think—will DeFi and RWAs keep fueling this trend? Drop your thoughts in the comments, and let’s keep the conversation going!
Published on July 26, 2025, at 08:20 PM +07


