Hey there, crypto enthusiasts! If you’ve been scrolling through X lately, you might have stumbled upon a fascinating post by MartyParty (@martypartymusic) from August 3, 2025, at 3:20 PM UTC. This tweet, which has sparked a lot of buzz, shares a detailed look at liquidation levels for some of the biggest cryptocurrencies out there—Bitcoin (BTC), Solana (SOL), Ethereum (ETH), XRP, HYPE, and Binance Coin (BNB). Accompanied by some eye-catching charts, this post is a goldmine for anyone looking to navigate the wild world of crypto trading. Let’s break it down together!
What Are Liquidation Levels, Anyway?
Before we dive into the charts, let’s get on the same page. Liquidation levels are specific price points where a trader’s leveraged position gets forcibly closed by an exchange if the market moves against them. Think of it like a safety net (or a trap, depending on your perspective) that kicks in when you can’t cover your losses with the collateral you’ve put up. In the crypto world, where prices can swing wildly, these levels are critical to watch, especially if you’re using leverage.
MartyParty’s post highlights these levels with a series of charts, giving us a snapshot of where things stand for these major tokens. The images show price levels with colorful bands, indicating where large amounts of liquidations could happen if the market hits those points.
Breaking Down the Charts
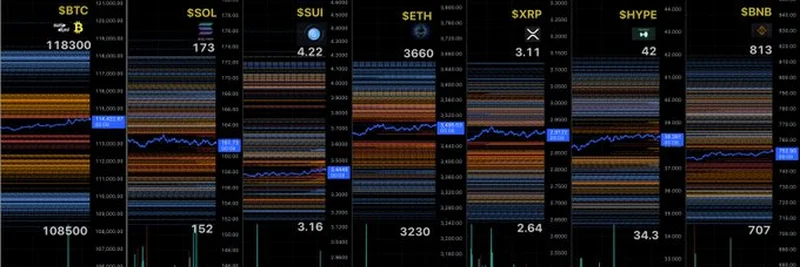
The tweet includes two images (both linking to the same URL, so we’ll assume they’re duplicates or slightly different views). Each chart focuses on a different cryptocurrency, with the following key details:
- Bitcoin (BTC): Current price around $118,300, with liquidation levels stretching from $108,500 to $119,000. That’s a tight range, suggesting potential volatility ahead!
- Solana (SOL): Priced at $173, with levels from $152 to $178. A bit more wiggle room here, but still a zone to watch.
- Ethereum (ETH): Sitting at $3,660, with a range from $3,230 to $3,800. A significant drop could trigger some liquidations.
- XRP: Currently at $3.11, with levels from $2.64 to $3.16. Traders are eyeing a breakout above $2.95, as one user excitedly noted.
- HYPE: Priced at $42, with a range from $34.3 to $45. This meme coin is showing some interesting movement!
- Binance Coin (BNB): At $813, with levels from $707 to $820. A solid range, but a dip could shake things up.
These charts use horizontal bands to show where clustered liquidation orders lie, with the current price marked by a blue line. The idea is that if the price hits these bands, it could trigger a cascade of liquidations, potentially causing big price swings.
What the Community Is Saying
The post has racked up some lively responses. One user, @theHYPEconomist, called it a “liquidity map” and loved the visual, while others like @IronLeS115 jokingly warned, “Don’t get liquidated 👀.” There’s optimism too—@kamleshchandrap is rooting for XRP to break $2.95, and @0x_moe shouted, “we r going up it’s so juicy!” Meanwhile, @QuantumAgeCap asked a great question: “what are these levels saying?” It’s clear this data is sparking both excitement and curiosity.
Why This Matters for Meme Token Fans
At Meme Insider, we’re all about keeping you in the loop on the latest crypto trends, including meme tokens like HYPE. While the charts focus on major coins, the principles apply to meme tokens too. Liquidation levels can signal when the market might get shaky, which is super useful if you’re trading or holding tokens with high volatility. For instance, HYPE’s current range suggests it could see some action soon—something to keep an eye on if you’re a fan!
How to Use This Info
If you’re new to trading, don’t worry—these charts might look intimidating, but they’re a tool to help you plan. Here’s a quick tip:
- Set Stop Losses: Place them below the lowest liquidation level to avoid getting caught in a cascade.
- Watch the Trends: If the price is nearing a dense liquidation zone, it might be a good time to brace for movement.
- Stay Informed: Follow updates like MartyParty’s to adjust your strategy.
You don’t need a pro version of TradingView (mentioned by @Hendrixblair) to start—many exchanges offer basic charting tools. But if you’re serious, tweaking settings to match these levels could give you an edge.
Final Thoughts
MartyParty’s liquidation levels post is a fantastic resource for crypto traders, offering a real-time peek into where the market might head next. Whether you’re into Bitcoin, Ethereum, or even meme coins like HYPE, understanding these levels can help you trade smarter. Got questions about the charts? Drop them in the comments—we’d love to dive deeper with you!

