If you’re into crypto trading, you’ve probably heard of Marty Party, a well-known figure in the cryptocurrency community. On July 15, 2025, at 04:17 UTC, Marty shared an intriguing post on X featuring a detailed chart of liquidation levels for various cryptocurrencies, including Bitcoin (BTC), Sui (SUI), Ethereum (ETH), XRP, and Hypurr (HYPE). Posted at 12:10 AM on the same day, this chart has sparked a lot of conversation among traders and enthusiasts. Let’s break it down and see what it means for the crypto world!
What Are Liquidation Levels?
For those new to trading, liquidation levels are price points where traders’ positions get automatically closed by exchanges if the market moves against them. This often happens when traders use leverage, borrowing funds to amplify their trades. The chart Marty shared shows these critical levels across multiple assets, helping traders anticipate potential price drops or reversals. Think of it as a roadmap for where the market might hit a “speed bump.”
Breaking Down the Chart
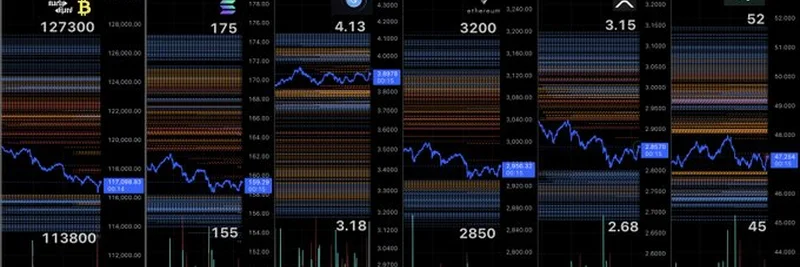
The image includes six panels, each focusing on a different cryptocurrency. Here’s a quick rundown:
- Bitcoin (BTC): The first panel shows BTC trading around $127,300, with a significant liquidation level at $113,800. This suggests a potential drop if the price keeps sliding.
- Sui (SUI): Priced at $175, with a key level at $155, indicating a possible support zone.
- Ethereum (ETH): Hovering around $4.13, with a liquidation level at $3.18— a notable decline if triggered.
- XRP: At $3.15, with a support level around $2.68.
- Hypurr (HYPE): Trading at $52, with a critical level at $45.
The charts use colorful lines and price markers to highlight where large volumes of leveraged positions might get liquidated, creating a visual guide for traders to watch.
Community Reactions
The post quickly attracted attention, with users like @Nurali35064698 predicting a drop to $77-$85 for Bitcoin, suggesting a bearish outlook. Others, like @andyho89310154, questioned where Marty gets this data, hinting at the chart’s credibility. Meanwhile, some fans, such as @333blacksea, simply gave a thumbs-up, showing the mixed sentiments in the community. There were also promotional replies offering trading signals, which is common in crypto X threads but worth filtering out for pure analysis.
Why This Matters in 2025
With the crypto market hitting a $3.4 trillion market cap this year and experiencing high volatility due to global economic factors like US trade tariffs, tools like Marty’s liquidation levels are gold for traders. They help identify where the market might stabilize or crash, especially for meme tokens and major assets alike. At meme-insider.com, we’re always on the lookout for such insights to help blockchain practitioners stay ahead.
How to Use This Information
If you’re a trader, keep an eye on these levels as potential entry or exit points. For instance, if Bitcoin nears $113,800, it could be a buying opportunity if you believe in a rebound, or a signal to sell if you expect further drops. Always combine this with your own research and risk management—crypto’s a wild ride!
Final Thoughts
Marty Party’s liquidation levels chart is a valuable snapshot of the crypto market as of July 15, 2025. Whether you’re into Bitcoin, meme tokens, or other assets, understanding these levels can sharpen your trading strategy. Stay tuned to meme-insider.com for more updates and deep dives into the latest crypto trends. What do you think about these levels? Drop your thoughts in the comments!

