If you’re into crypto trading, you’ve probably come across Marty Party’s latest tweet from July 24, 2025, at 00:44 UTC. This post, shared by the popular trader @martypartymusic, dives into the world of liquidation levels for major cryptocurrencies like Bitcoin (BTC), Solana (SOL), Ethereum (ETH), and others. With an attached chart and some handy advice, it’s a goldmine for traders looking to navigate the volatile crypto market. Let’s break it down and see what it means for you!
What Are Liquidation Levels?
First things first—let’s talk about liquidation levels. In crypto trading, a liquidation happens when a leveraged position can’t cover its losses, forcing the exchange to close it automatically. Think of it as a safety net (or a trap, depending on your perspective) that kicks in when the market moves against you. Marty’s chart highlights these levels for various assets, showing where prices might trigger a cascade of liquidations. The colorful lines and numbers give traders a roadmap to avoid getting caught out.
Breaking Down the Chart
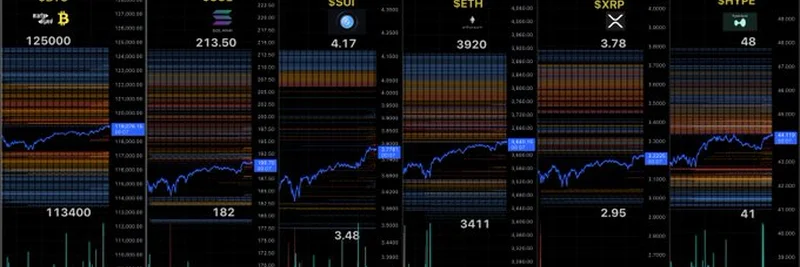
The image Marty shared is a detailed snapshot of liquidation levels as of 8:43 PM on July 23, 2025. It covers six major cryptocurrencies:
- Bitcoin (BTC): Sitting at $125,000, with a key level at $113,400.
- Solana (SOL): Priced at $213.50, with a notable level at $182.
- Sui (SUI): At $4.17, with $3.48 as a critical point.
- Ethereum (ETH): Trading at $3,920, with $3,411 to watch.
- XRP: At $3.78, with $2.95 as a potential support.
- Hype (HYPE): At $48, with $41 as a lower boundary.
These levels are marked by blue and white lines, indicating where long positions might get liquidated if the price drops. Marty suggests holding long calls and either buying more (a strategy called dollar-cost averaging, or DCA) or entering a position once the lower blue lines are cleared.
Marty’s Trading Tips
Marty’s advice is pretty straightforward. If you’re holding long positions (betting the price will go up), keep an eye on those lower blue lines. Clearing them could signal a good time to buy more or jump in with a new trade. He also mentions the white numbers as stop-loss points—prices where you might want to cut your losses to protect your investment. This is a smart move in the wild world of crypto, where prices can swing dramatically.
In the thread, Marty responds to a question about whether more liquidation levels exist below the current ones. He explains that lower leverage levels (like 25x to 100x on a 30-minute timeframe) could trigger further liquidations as exchanges “hunt” these positions. It’s a reminder that crypto trading isn’t just about the chart—it’s a game of psychology and market mechanics too!
Why This Matters for Meme Token Fans
At Meme Insider, we’re all about keeping you in the loop on meme tokens and broader crypto trends. While Marty’s chart focuses on established coins, the principles apply to meme tokens too. These volatile assets often see wild liquidation events, especially with high leverage. Understanding levels like these can help you trade smarter, whether you’re into Dogecoin, Shiba Inu, or the next big meme coin hype.
Practical Takeaways
So, what can you do with this info? Here are a few tips:
- Watch the Levels: Use Marty’s chart as a guide to spot potential entry or exit points.
- Set Stop Losses: Those white numbers are your friends—set them to limit your risk.
- DCA Wisely: If you’re adding to a position, wait for those lower blue lines to clear for better odds.
- Stay Updated: Follow Meme Insider for more insights on crypto trends and trading strategies.
Trading crypto can feel like a rollercoaster, but tools like Marty Party’s liquidation levels give you a bit more control. Whether you’re a seasoned trader or just dipping your toes into the market, this tweet is a great starting point. Got questions? Drop them in the comments, and let’s dive deeper into the crypto world together!


