Hey there, crypto enthusiasts! If you’ve been scrolling through X lately, you might have stumbled upon a fascinating post by Marty Party (@martypartymusic) from July 30, 2025, at 4:50 PM UTC. This post dives into the liquidation levels of major cryptocurrencies like Bitcoin (BTC), Solana (SOL), and Ethereum (ETH) right after the Federal Open Market Committee (FOMC) meeting. Let’s break it down in a simple way and explore what this means for the crypto market.
What Are Liquidation Levels?
First things first—let’s talk about liquidation levels. In crypto trading, liquidation happens when a trader’s position is forcibly closed because they no longer have enough funds (or margin) to keep it open. This often occurs with leveraged trades, where you borrow money to amplify your position. If the market moves against you and your account balance drops below a certain point, the exchange steps in and sells your assets to cover the debt. Marty’s charts highlight these critical price points where liquidations could trigger, giving traders a heads-up on potential market moves.
Breaking Down Marty’s Charts
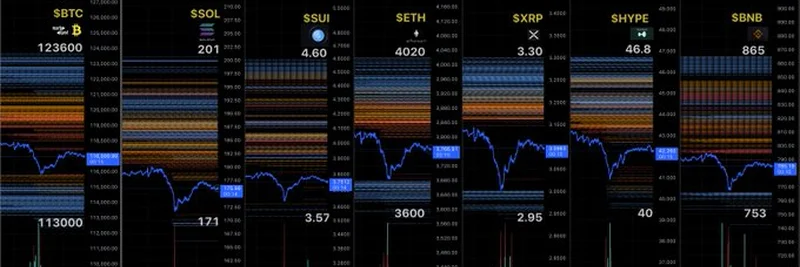
Marty shared two images showing liquidation levels for several top cryptocurrencies, including BTC ($123,600), SOL ($201), SUI ($4.60), ETH ($4,020), XRP ($3.30), HYPE ($46.8), and BNB ($865). These charts are packed with colorful lines and numbers, but here’s what stands out:
- Price Ranges: Each chart shows a current price (e.g., $123,600 for BTC) and a lower range where liquidations might kick in (e.g., $113,000 for BTC). This range represents a danger zone where many traders could get wiped out if the price drops.
- Post-FOMC Timing: The data is timestamped right after the FOMC meeting on July 29-30, 2025. The FOMC’s decisions on interest rates can shake up markets, and crypto is no exception. Higher rates can cool down risk assets like crypto, while lower rates might spark a rally.
For example, XRP’s chart shows a current level of $3.30 with a potential drop to $2.95, as one user (@kfrazine) pointed out in the thread. This suggests that if XRP falls below $2.95, a wave of liquidations could push the price even lower—or trigger a rebound if buyers step in.
What the Community Thinks
The thread sparked some lively reactions! Some users, like @theHYPEconomist, were curious about the specifics, while others, like @ShezzSaid, hinted at “liquidity to the upside,” meaning there might be room for prices to climb if the market absorbs the liquidations. Optimists like @EdwrdLetusHands and @dimazki are betting on a big upward move, with comments like “we goin 👆” and “next leg up gonna be violent.” This buzz shows how much traders are watching these levels for their next big play.
Why This Matters Post-FOMC
The FOMC meeting often sets the tone for financial markets, and crypto is highly sensitive to these shifts. With interest rates currently held steady at 4.25-4.50% (as of the latest update), the market might be bracing for volatility. Historically, a stable or declining rate environment can boost crypto prices, as seen in 2023-2024 when Bitcoin and Ethereum rallied. Marty’s analysis could be a roadmap for traders looking to navigate this post-FOMC landscape.
Tips for Crypto Traders
If you’re diving into trading based on liquidation levels, here are a few tips:
- Set Stop Losses: Protect your investment by setting a stop loss below the liquidation range to avoid getting caught in a sudden drop.
- Watch the Trends: Keep an eye on how altcoins like XRP or HYPE follow Bitcoin’s lead, as they often move in tandem (learn more about altcoin trends here).
- Stay Updated: Follow threads like Marty’s on X for real-time insights, but always double-check with your own research.
Final Thoughts
Marty Party’s liquidation levels post is a goldmine for anyone trying to understand the crypto market’s next move after the FOMC meeting. Whether you’re a Bitcoin bull or an altcoin enthusiast, these charts offer a glimpse into where the market might head. Head over to meme-insider.com for more deep dives into meme tokens and blockchain trends, and let us know your thoughts in the comments below!
Got questions about this analysis? Drop them below, and we’ll dig deeper for you!
, which matches the one provided.***](https://cdn.meme-insider.com/20251105-pump-fun-integrates-moonpay-easier-fiat-onramps-for-solana-memecoins.webp)