Hey there, crypto enthusiasts! If you’ve been scrolling through X lately, you might have stumbled upon a fascinating post by MartyParty (@martypartymusic) from August 9, 2025, at 9:20 PM UTC. This tweet, which has sparked some buzz, shares a detailed look at liquidation levels for several major cryptocurrencies, including Bitcoin (BTC), Solana (SOL), Ethereum (ETH), and others. Accompanied by two striking chart images, it’s a goldmine for anyone interested in trading or just curious about market movements. Let’s break it down together and see what it means, especially with a nod to the meme token world we cover here at Meme Insider.
What Are Liquidation Levels?
First things first—let’s clarify what “liquidation levels” mean. In crypto trading, liquidation happens when a trader’s position is automatically closed because the market moves against them, and they can’t cover the losses. These levels are critical price points where exchanges like Binance or Bybit might liquidate positions to prevent further debt. The charts MartyParty shared show these thresholds for various assets, giving traders a heads-up on where the market might get shaky.
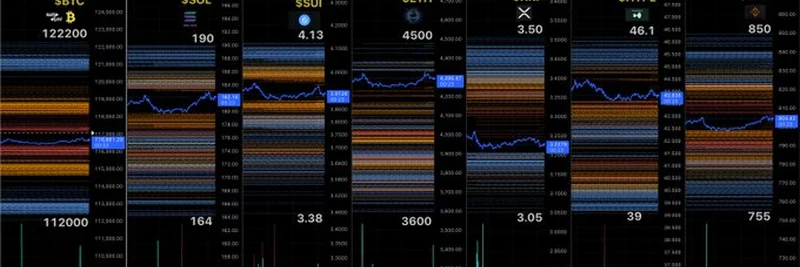
The images display a series of candlestick charts with colorful bands indicating potential liquidation zones. For example, BTC is shown with a price around $122,200, while SOL hovers near $164. These bands represent areas where large positions could be wiped out, often leading to sharp price swings—something meme token traders know all too well!
Breaking Down the Charts
Let’s take a closer look at the assets featured:
- Bitcoin (BTC): Priced at $122,200, the chart shows multiple liquidation bands, suggesting heavy activity around this level. A drop below could trigger a cascade of liquidations.
- Solana (SOL): At $164, this chart hints at volatility, with bands tightening around the current price—exciting news for SOL-based meme tokens!
- Ethereum (ETH): Sitting at $3,600, ETH’s chart shows a similar pattern, with liquidation zones that could impact altcoin markets.
- Others: Assets like Sui (SUI), XRP, HYPE, and SBN also feature, each with their own liquidation thresholds (e.g., SUI at $3.38, HYPE at $39).
These charts are likely sourced from a platform like CoinGlass, which provides real-time liquidation heatmaps. The data is timestamped for 9:20 PM on August 9, 2025, meaning it reflects the market state just hours before this article’s context at 12:47 PM JST on August 10, 2025.
Why This Matters for Meme Token Fans
At Meme Insider, we’re all about meme tokens, and this tweet has relevance even beyond the big players like BTC and ETH. Meme tokens often ride the coattails of major market movements. For instance, if Bitcoin’s liquidation levels trigger a sell-off, altcoins and meme tokens like Dogecoin or Shiba Inu could feel the ripple effects. The mention of HYPE in the charts is particularly intriguing—could this be a meme token gaining traction? It’s a reminder to keep an eye on how macro trends influence the wild world of meme currencies.
What Traders Are Saying
The thread following MartyParty’s post is a mix of excitement and promotion. Some users, like @Riverfly706, hype up $BILLY on the Base network, suggesting it’s the next big meme token. Others, including what seem to be duplicate accounts, push Telegram groups with trading signals—be cautious, as these can sometimes be scams! The chatter shows the community’s eagerness to act on this data, but it’s smart to verify info before jumping in.
How to Use This Info
If you’re a trader or a blockchain practitioner, these charts are a tool to anticipate market shifts. Look for:
- Support and Resistance Levels: The bands indicate where prices might stabilize or break.
- Risk Management: Set stop-loss orders below liquidation zones to protect your portfolio.
- Meme Token Opportunities: Watch how major liquidations affect smaller tokens—sometimes they create buying dips!
For a deeper dive, platforms like Token Metrics offer crypto signals to guide your decisions, though always double-check with your own research.
Final Thoughts
MartyParty’s tweet is a snapshot of the crypto market’s pulse as of August 9, 2025. Whether you’re trading BTC, exploring ETH, or hunting the next meme token gem, understanding liquidation levels can give you an edge. Stay tuned to Meme Insider for more updates, and let us know your thoughts in the comments—did this chart change your trading strategy?