Hey there, crypto enthusiasts! If you’ve been keeping an eye on the market, you’ve probably noticed some wild swings in Bitcoin (BTC) and Ethereum (ETH) Exchange-Traded Funds (ETFs) lately. A recent post by Shaunda Devens from Blockworks Research on X has sparked some interesting conversations, and we’re here at Meme Insider to break it all down for you. Let’s dive into the latest ETF flow trends and what they might mean for the future of blockchain investments.
The Big Outflow Streak
According to the post, Tuesday marked the fourth consecutive day of BTC ETF net outflows—the longest streak since April 2025, when tariff concerns were at their peak. Over those four days, BTC ETFs saw a whopping $1.45 billion in outflows. ETH ETFs weren’t spared either, with a massive $617 million pulled out across Friday and Monday—the largest outflows since their inception. That’s a lot of money hitting the exit door!
So, what’s driving this? The post points to some big-picture (or “macro”) factors. Slightly higher inflation, softer employment data, and a hawkish tone from the Federal Reserve (the Fed) have spooked investors. In simple terms, when inflation rises and the Fed hints at tighter monetary policies (like raising interest rates), people tend to pull back from riskier investments like crypto and park their money in safer options, like bonds.
A Surprise Turnaround
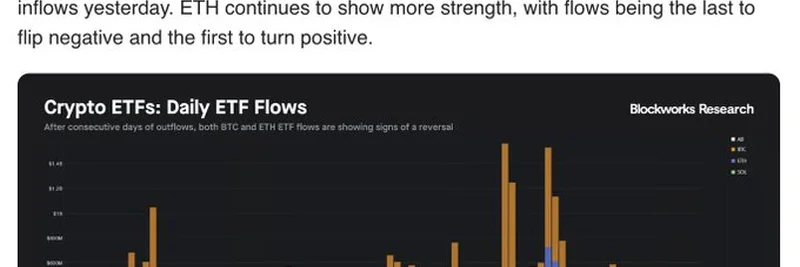
But here’s where it gets exciting! Despite the outflows, there’s a hint of a shift. Both BTC and ETH ETFs recorded net inflows yesterday, suggesting a possible change in sentiment. ETH, in particular, is showing some resilience—its flows were the last to turn negative and the first to flip positive. This could mean investors are starting to feel more confident about Ethereum, possibly due to its growing use in decentralized finance (DeFi) and other blockchain innovations.
The chart from Blockworks Research tells the story visually. You can see the tall orange and blue bars representing outflows, especially around late July, followed by a recent uptick. It’s a rollercoaster, but that recent green shoot of inflows is definitely worth watching.
Why It Matters for Meme Token Fans
You might be wondering, “What does this have to do with meme tokens?” Well, the broader crypto market often sets the tone for smaller, trend-driven assets like meme coins. When big players like BTC and ETH ETFs see inflows, it can signal a bullish (optimistic) market, which often lifts the entire ecosystem—including those quirky tokens you love. Plus, the macro factors affecting ETFs (like inflation and Fed policies) can indirectly influence meme token hype cycles. So, keeping an eye on these trends could help you time your next big meme coin move!
What’s Next?
The post hints that treasury firms and their strategies might play a big role moving forward. With some firms approaching a market net asset value (mNAV) multiple of 1, we could see more action to stabilize prices—think stock buybacks or partnerships with market makers. This could be a game-changer for ETF flows and, by extension, the whole crypto market.
For now, the data suggests we’re at a turning point. Will ETH’s strength continue to lead the charge? Will macro factors ease up, or will we see more volatility? At Meme Insider, we’ll keep you posted as this story unfolds. Drop your thoughts in the comments—do you think this is the start of a bullish run, or just a blip on the radar?