Hey there, crypto enthusiasts! If you’ve been keeping an eye on Bitcoin’s wild price swings, you might have noticed they don’t always follow the usual hype cycles we often hear about. A recent tweet from TechDev_52 on July 25, 2025, dropped a fascinating bombshell: Bitcoin’s price movements might actually mirror the broader business cycle. Let’s dive into this intriguing idea and see what it means for your next crypto move.
What’s the Business Cycle Got to Do with Bitcoin?
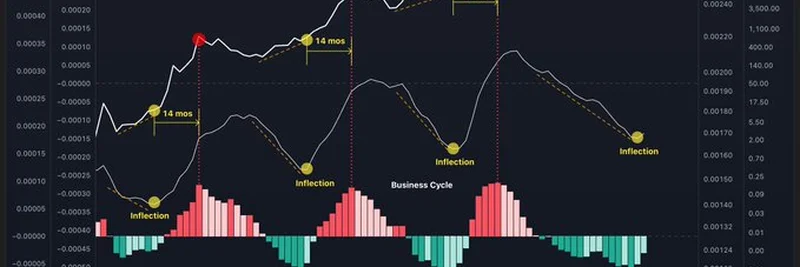
First off, let’s break it down. The business cycle is like the economy’s heartbeat—alternating between booms (when things are thriving) and busts (when things slow down). TechDev_52 suggests that Bitcoin doesn’t just dance to its own tune but follows this rhythm. The tweet comes with a slick chart created using TradingView, showing Bitcoin’s price history alongside a visual of the business cycle from 2012 to 2025.
Check out this chart:
The chart highlights key moments called “inflection points”—where the business cycle shifts from growth to decline or vice versa. According to TechDev_52, Bitcoin tends to hit its peak about 14 months after these inflection points. Pretty cool, right? It’s like Bitcoin is waiting for the economy to give it a green light before soaring to new heights.
Breaking Down the Pattern
So, what does this mean in practice? Here’s the gist:
- Bitcoin Tops When the Business Cycle Tops: The chart shows Bitcoin hitting major highs (marked with red circles) right around the time the business cycle peaks.
- Parabolic Growth After Inflection: When the cycle inflects (shifts direction), Bitcoin often starts its explosive upward trend. The “ramp” period—the time it takes to reach this inflection—sets the stage.
- 14-Month Rule: Historically, Bitcoin has topped 14 months after these inflection points, giving us a potential timeline to watch.
For example, if we’re currently in an inflection phase (as the chart suggests around 2023-2024), we might be looking at a peak sometime in 2025 or 2026. That’s a big deal for anyone planning their crypto investments!
Why This Matters for Crypto Fans
This theory flips the script on the usual “halving cycle” narrative, where Bitcoin’s price is tied to its supply cuts every four years. Instead, TechDev_52 argues it’s more about economic liquidity and when big money decides to jump in. Responses to the tweet, like from Crypto Seth, hint that we might still be in for more growth, while others like Álpha Overlord question if this could trap less-savvy traders.
It’s also a reminder that Bitcoin might be maturing into a “macro asset”—something influenced by big economic trends like inflation or GDP, as noted by Fidelity Digital Assets. This could make it a hedge against traditional market moves, not just a speculative bet.
What to Watch For
Of course, nothing’s set in stone. The chart’s latest inflection point (around 2023) doesn’t perfectly align with past patterns, as pointed out by ZapRowsdower. Factors like black swan events, new regulations, or ETF flows could shake things up. But if TechDev_52’s 14-month rule holds, we’re in for an exciting ride over the next year or so.
Takeaway for Blockchain Practitioners
For those of you deep in the blockchain world, this insight could refine your trading strategies. Keep an eye on economic indicators like business cycle data (maybe check YCharts for real-time trends) and pair it with Bitcoin’s price action. It’s not just about meme tokens or hype anymore—understanding these macro connections could give you an edge.
What do you think? Does this business cycle theory resonate with your Bitcoin predictions? Drop your thoughts in the comments, and let’s keep the conversation going at meme-insider.com! Stay curious, and happy trading!